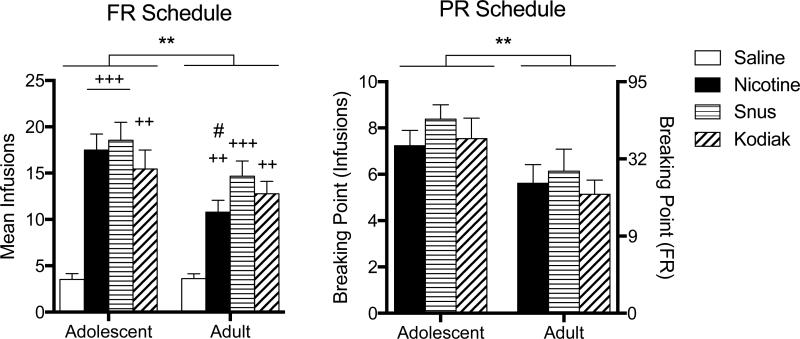
Figure 2. Mean Infusions During the Acquisition and Progressive-Ratio Phases of Experiment 1.
Note. Mean (± SEM) infusions earned per session in each group of adolescent and adult rats across the last three sessions under the FR 1 schedule in Experiment 1 are shown in the left panel. Mean (± SEM) breaking points (expressed as infusions on the left y-axis and associated last completed FR on the right y-axis) across the last three sessions under the PR schedule in Experiment 1 are shown in the right panel. No saline data are shown for the PR schedule because data were only analyzed for rats that met acquisition criteria. Main effect of age, **p < .01. Different from saline, ++p < .01, +++p < .001. Different from nicotine, #p < .05.

