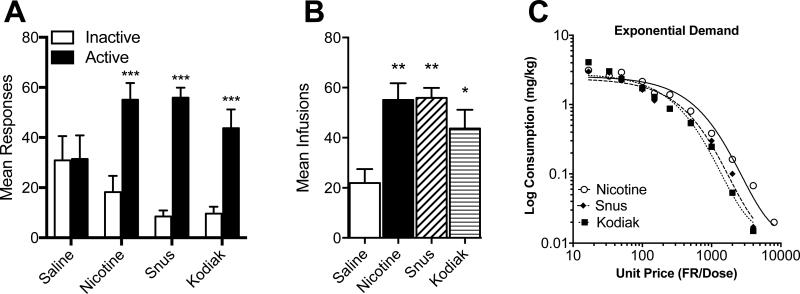
Figure 3. Mean Responses, Infusions, and Exponential Demand Curves During Experiment 2.
Note. Mean (± SEM) responses on the active and inactive lever (panel A) and mean (± SEM) infusions earned per session (panel B) in each group of adolescent rats during the last three sessions under the FR 1 schedule in Experiment 2. Panel C shows nicotine consumption in each group as a function of unit price with associated exponential demand curve fits during demand curve assessment in Experiment 2. Individual and group demand parameter estimates are shown in Table 1. Different from saline (panel A), ***p < .001. Different from saline (panel B), *p < 0.05, **p < 0.01.

