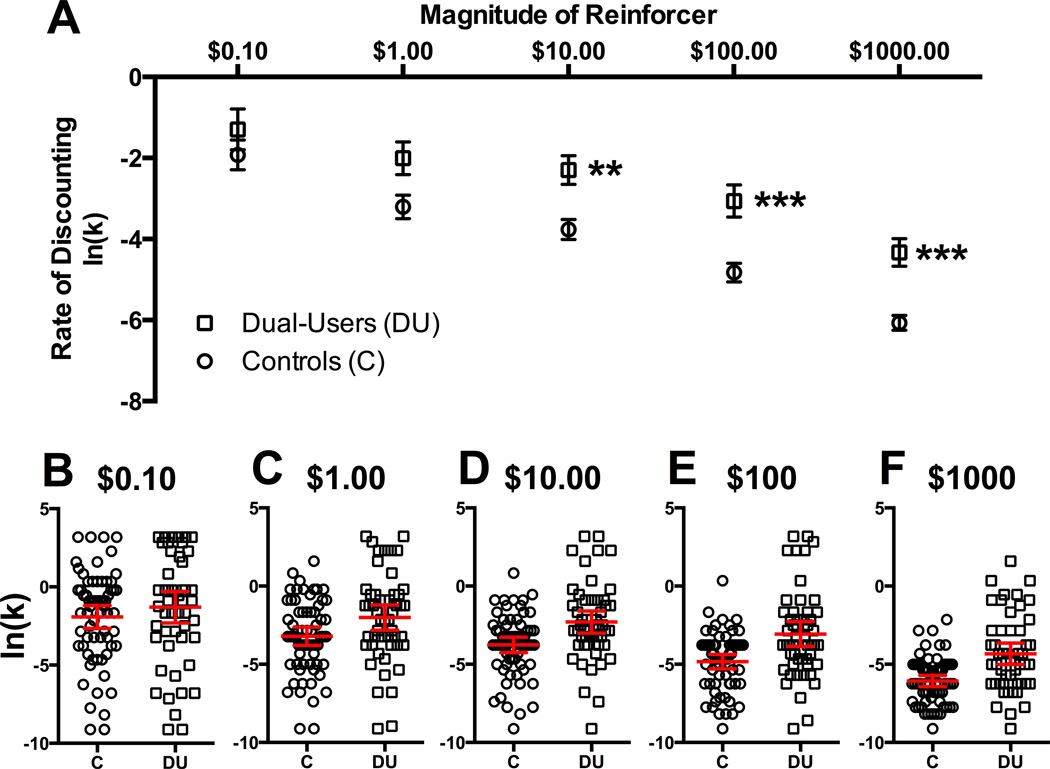
Figure 1.
Displayed in panel A are group comparisons of discounting rates (as natural-log-normalized k values) between controls with low AUDIT ( < 8) & FTCD ( < 4) scores and dual-substance users with high AUDIT ( > 10) and FTCD ( > 4) scores, over all five magnitudes of reinforcer examined. Error bars indicate standard error of the mean. Asterisks denote levels of significance of group difference between mean discounting rates. Panels B-F display group data including mean and and 95% confidence intervals as well as individual data points representing individual participant’s natural-log-normalized discounting rates across the $0.10, $1.00, $10.00, $100.00, and $1000.00 conditions, in that order.

