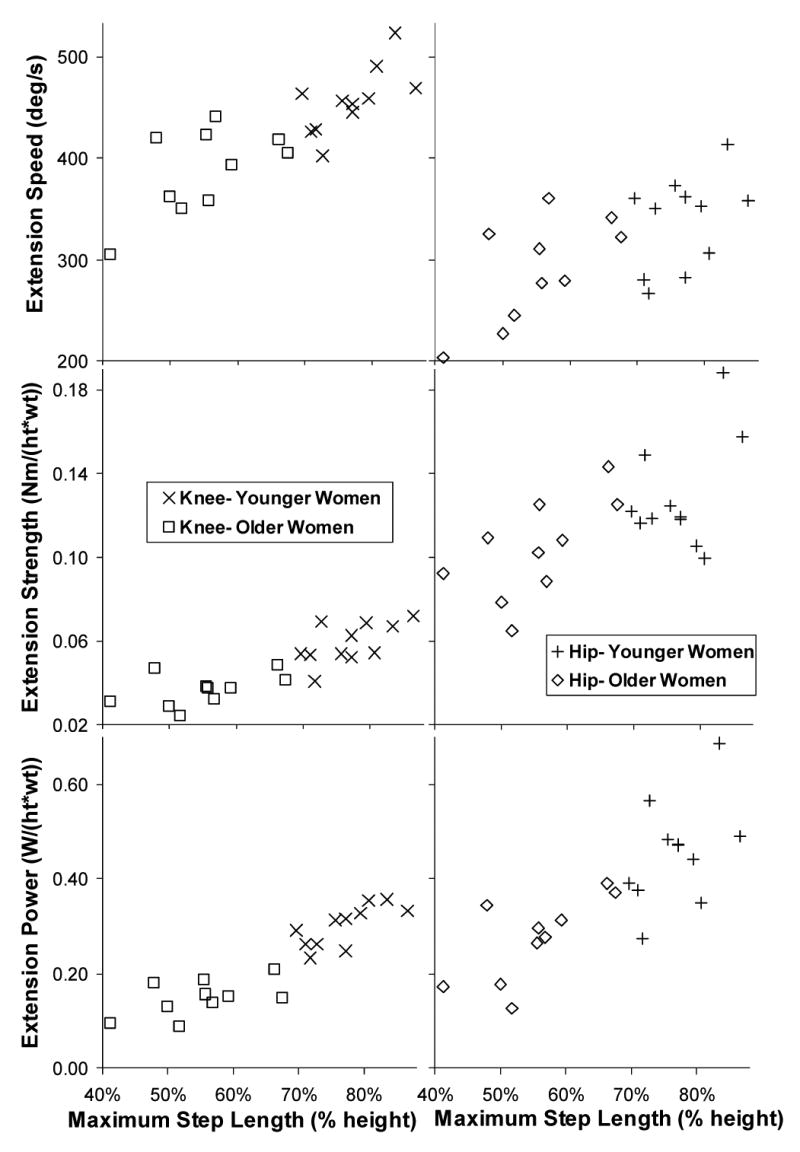
Fig. 2.

Normalized knee (left column) and hip (right column) extension speed (top row), strength (middle row), and power (bottom row) capacities plotted against normalized Maximum Step Length (MSL) by age group for “Out & Back” MSL version. “ht” refers to subject height in m and “wt” refers to subject weight in N.
