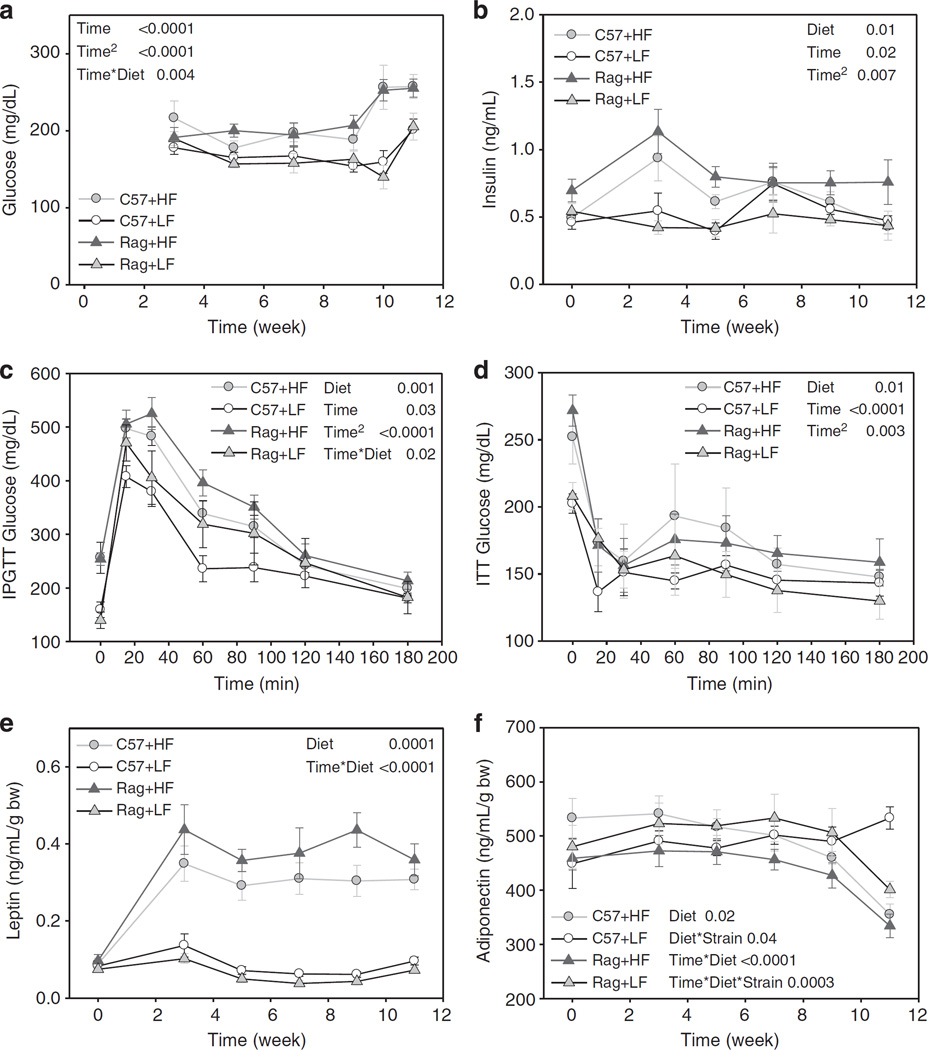
Figure 3.
Plasma concentration of glucose (a), insulin (b), intraperitoneal glucose tolerance tests (IPGTTs) (c), insulin tolerance tests (ITT) (d), plasma concentration of leptin (e) and adiponectin (f) in C57 and Rag1 − / − mice maintained on LFD or HFD. Data were analyzed using repeated-measures analysis of variance and post-hoc multiple comparison procedures. Values are means± s.e.; n = 6 mice/group.

