
Figure 7. EEG activity during measurements before and after opioid application.
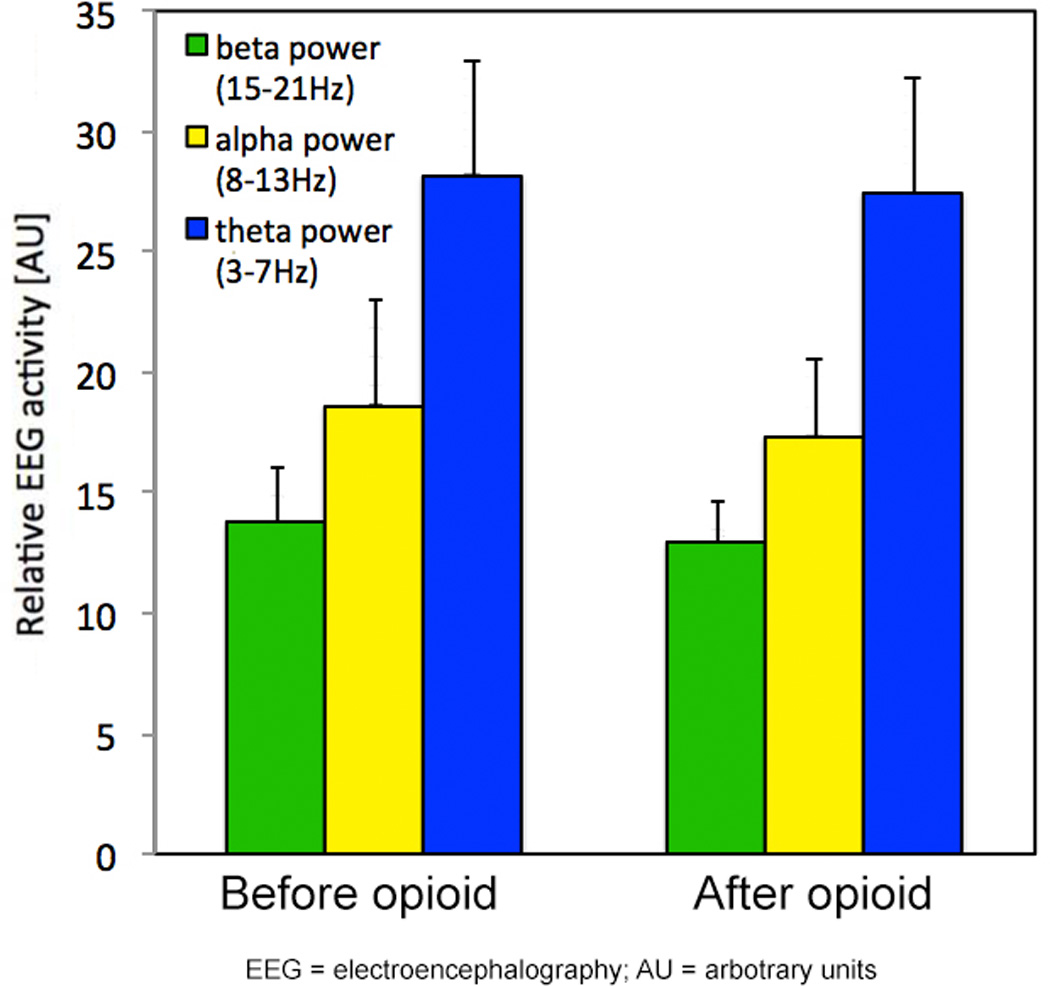
Electroencephalography (EEG) activity was quantified by EEG spectroscopy as indicators of cortical arousal. Beta-, alpha- and theta-frequency bands were calculated using Fast-Fourier-Transformation (FFT; non-overlapping Hann 256 bit windows) on 5-second epochs of the filtered EEG signal 0.8 to 55 Hz. The spectral distribution was categorized into beta (15–21 Hz), alpha (8–13 Hz), and theta (3–7 Hz) frequency band and was expressed as a percentage of total EEG power across the entire frequency band in each 20-s epoch of sleep. Alpha, beta, and theta EEG activity did not differ during measurements before and after opioid application.
AU = arbitrary units