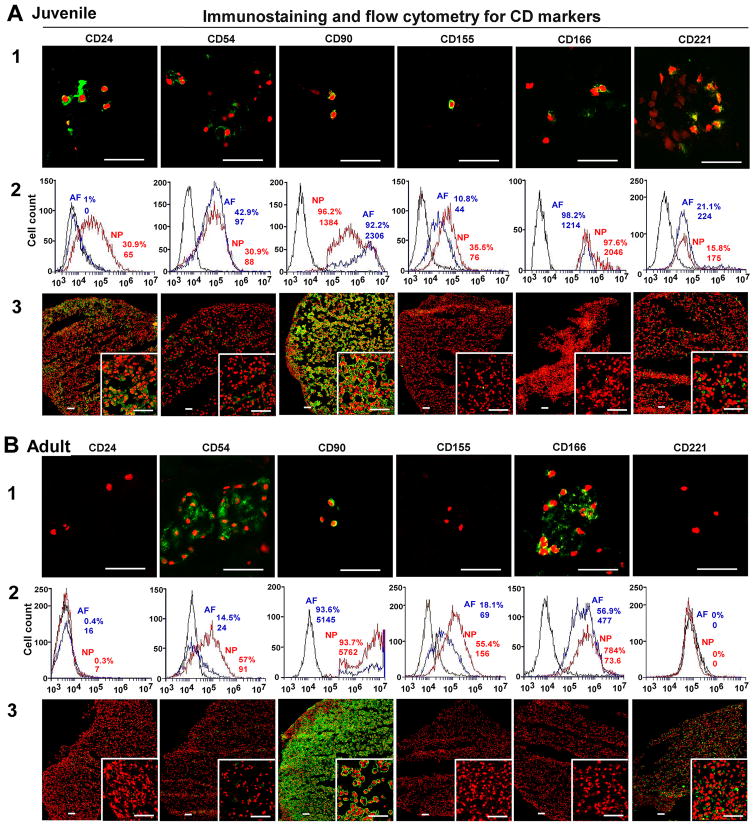
Figure 1. Immunostaining and flow cytometry detection for NP CD markers.
Immunostaining and flow cytometry illustrated aging-related changes in the expression of NP phenotype markers (A: Juvenile, B: Adult). A1 and B1: staining in native surgical tissue. Bar: 50μm; A2 and B2: Flow cytometry. Representative histograms of flow cytometry at left illustrate the relative fluorescence intensity of NP markers on X-axis for isolated cells via tissue incubation (cell surface: CD24, CD54, CD90, CD 155, CD166 and CD221). The numbers appeared in each histogram indicate the percentage of positive fluorescence labeled cells and mean fluorescence intensity (MFI) for each cell type. (Black line: isotype control, blue line: AF cells, red line: NP cells); A3 and B3: staining in 3D construct (days 28). Bar: 50μm.

