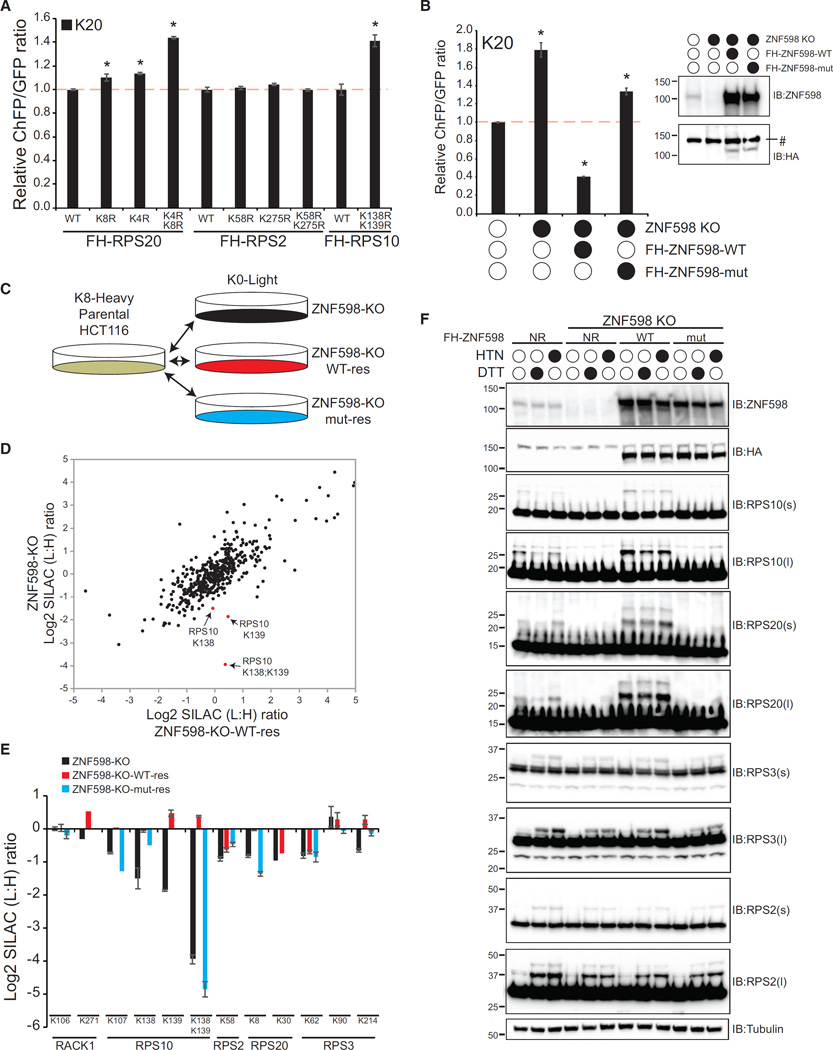
Figure 2. Regulatory Ubiquitylation of RPS20 and RPS10 Is Mediated by ZNF598 and Facilitates Translation Stall Resolution.
(A) K20 reporter ChFP:GFP ratios in 293T cells with stable expression of FLAG-HA (FH)-tagged wild-type (WT) RPS20, RPS2, or RPS10 or versions containing the indicated lysine-to-arginine mutations. Error bars represent SEM for three separate transfections and flow cytometry measurements. *p < 0.01 using Student’s t test, comparing cells expressing mutant ribosomal proteins with cells expressing wild-type ribosomal proteins.
(B) K20 reporter ChFP:GFP ratios in parental HCT116 cells, ZNF598-KO cells, or ZNF598-KO cells with stable ectopic expression of FLAG-HA-tagged wild-type or C29A mut ZNF598. *p < 0.01 using Student’s t test, comparing parental cells with ZNF598-engineered cell lines. Inset: whole-cell extracts from parental HCT116 cells, ZNF598-KO cells, or ZNF598-KO cells with exogenous FLAG-HA-tagged wild-type or mutant ZNF598 expression were immunoblotted with the indicated antibodies. #, non-specific band.
(C) Schematic of SILAC-based proteomic experiments.
(D) Scatterplot of the Log2 SILAC ratio (L:H) for all quantified ubiquitin-modified peptides from ZNF598-KO cells and ZNF598-KO cells with exogenous wild-type ZNF598 expression (light) compared with unlabeled (heavy) parental HCT116 cells. Selected ubiquitin-modified peptides from RPS10 are shown in red.
(E) Log2 SILAC ratio (L:H) for selected ubiquitin-modified peptides from 40S ribosomal proteins in ZNF598-KO cells (black bars), ZNF598-KO cells with exogenous wild-type ZNF598 expression (red bars), or ZNF598-KO cells with exogenous mutant ZNF598 expression (blue bars) compared with parental cells. The site of ubiquitin modification is indicated. Error bars represent SEM from multiple peptide mass spectrometry (MS) quantifications.
(F) Parental HCT116 cells, ZNF598-KO cells, or ZNF598-KO cells rescued with exogenous wild-type or mutant ZNF598 expression were untreated or treated with HTN or DTT for 4 hr. Whole-cell extracts were analyzed by SDS-PAGE and immunoblotted with the indicated antibodies. s and l denote short or long exposures, respectively.
See also Figure S3.

