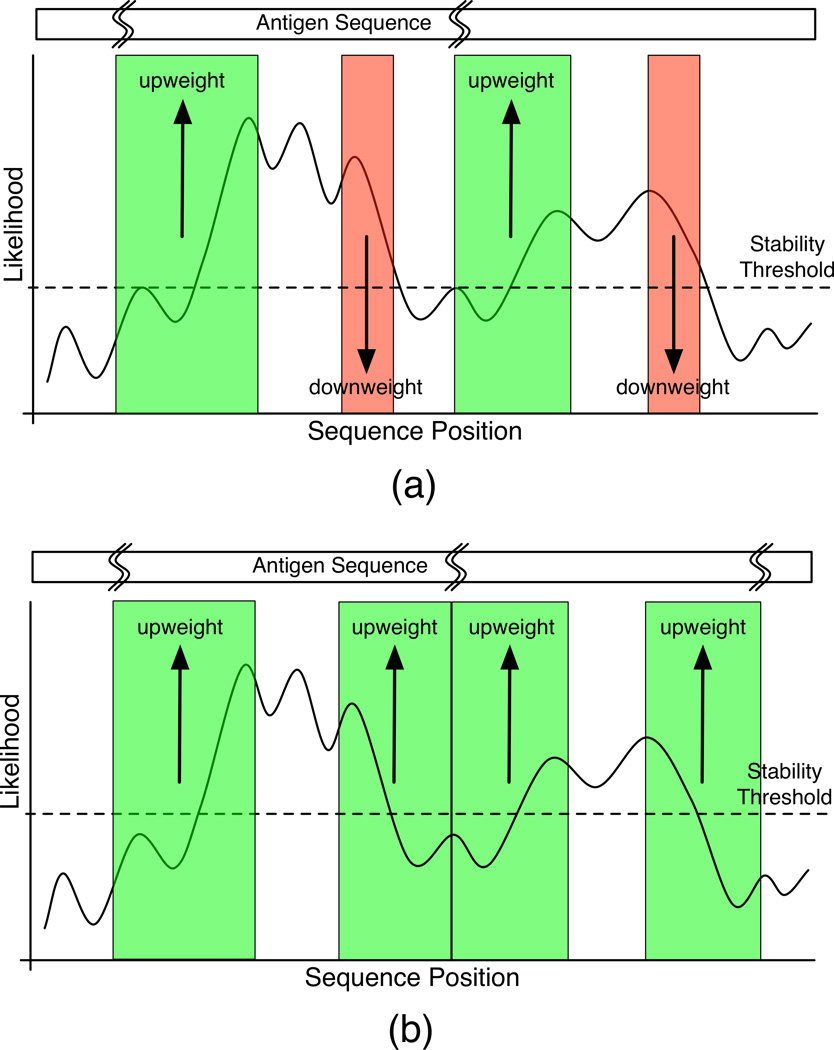
Figure 1. Epitope Likelihood construction.
Epitope likelihood is constructed by reweighting the aggregate stability score in relation to an assumed proteolytic site at the midpoint of an unstable region. Depending on the context we (a) upweight regions downstream of proteolytic sites, or (b) regions both upstream and downstream of proteolytic sites (upweighted regions are shaded in green and downweighted regions are shaded in red).

