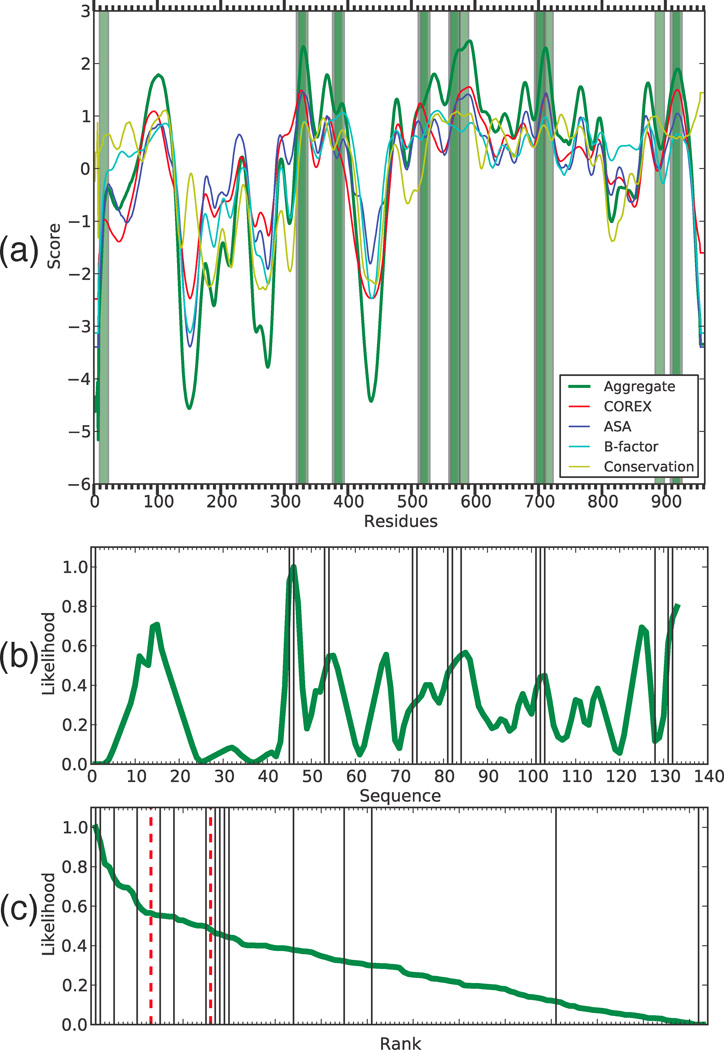
Figure 5. Adenovirus type 5 hexon predictions.
(a) Conformational stability data is shown by residue, epitopes are shaded green bars. (b) The computed epitope likelihood score for sequential 15-mers (epitopes shown as black lines) is shown along with (c) the rank-order view of the scores with 90th and 80th percentile thresholds (red dashed lines).

