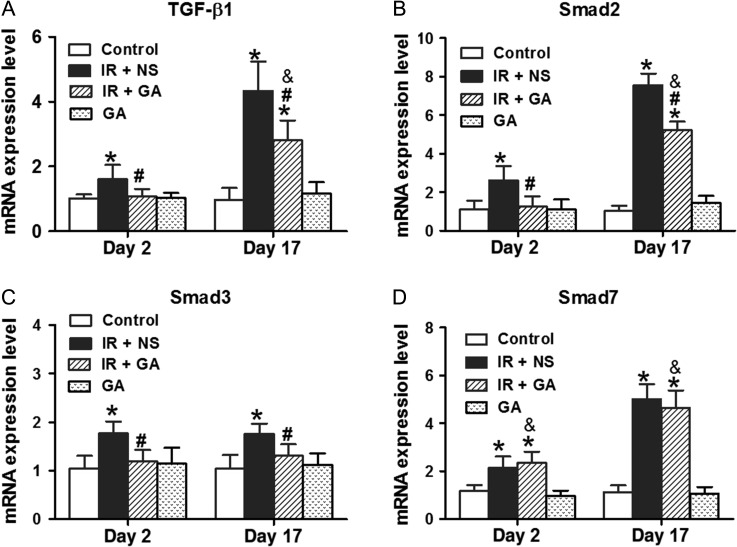
Fig. 3.
qRT-PCR analyses of gene expression in mouse lungs after irradiation. Mice were irradiated with a single fraction of 12 Gy and treated with NS or GA (except for the control group and GA group). mRNA levels of TGF-β1 (panel A), Smad2 (panel B), Smad3 (panel C) and Smad7 (panel D) were analyzed by qRT-PCR 2 days and 17 days after irradiation. Data are the mean ± SD. *P < 0.05, vs control group; #P < 0.05, vs IR + NS group; &P < 0.05, vs GA group, at identical time-points, by one-way ANOVA (followed by Bonferroni's multiple comparison test). IR = irradiation, NS = normal saline, GA = glycyrrhetinic acid.

