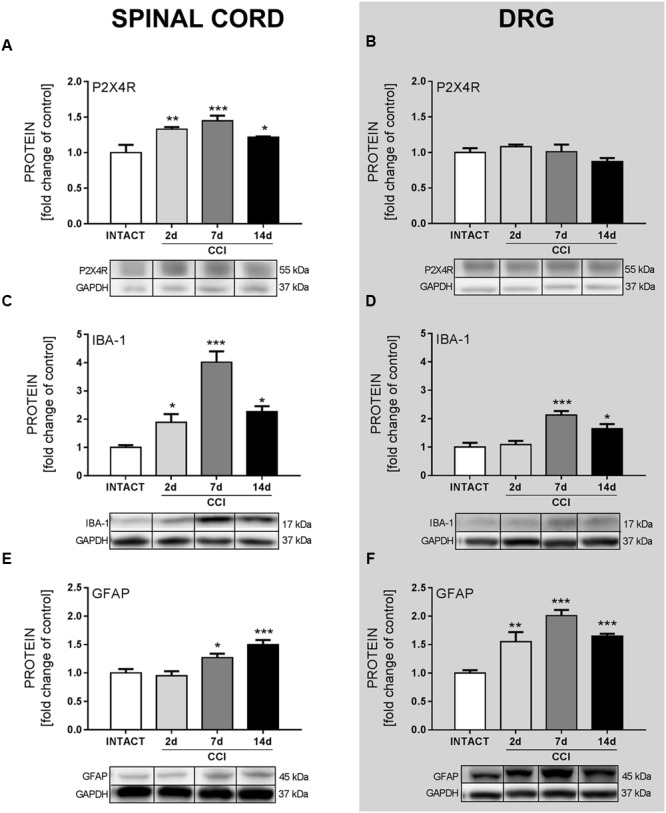
FIGURE 1.

The Western blot analysis of the protein levels of the P2X4R (A,B), IBA-1 (C,D), and GFAP (E,F) in the ipsilateral dorsal lumbar spinal cord (A,C,E) and dorsal root ganglia (DRG) (B,D,F) tissue on days 2, 7, and 14 after chronic constriction injury (CCI) in rats. The representative bands are shown below each column of respective group on the graph and come from the same membrane photo. Samples from different groups were not next to each other so were cut from different locations and set together. Data are presented as the mean ± SEM of 4–7 samples per group. Inter-group differences were analyzed using one-way ANOVA followed by Bonferroni’s multiple comparisons test. ∗p < 0.05, ∗∗p < 0.01, and ∗∗∗p < 0.001 compared to the INTACT group.
