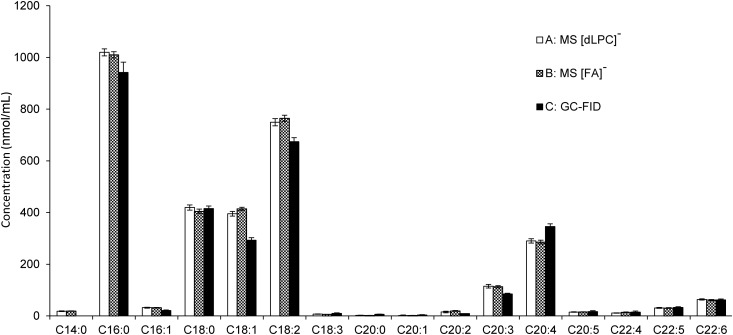
Fig. 5.
Comparison of FA distribution in the PL of a NIST human plasma sample obtained by two different analytical approaches. In the cases of A and B, samples were analyzed using PIS m/z +184 followed by MS3 fragmentation for isobaric PC determination. Isobaric PCs were determined using A [dLPC]− and B [FA]− anions. The obtained data was recalculated for the individual FAs. In the case of C, the FA distribution was determined using GC-FID as methyl esters after transesterification. Methyl tetradecanoate analyzed by GC-FID was not used due to the fact that the analysis was influenced by coelution with methylated BHT. Bars represent mean ± 99% confidence interval of four repetitions.

