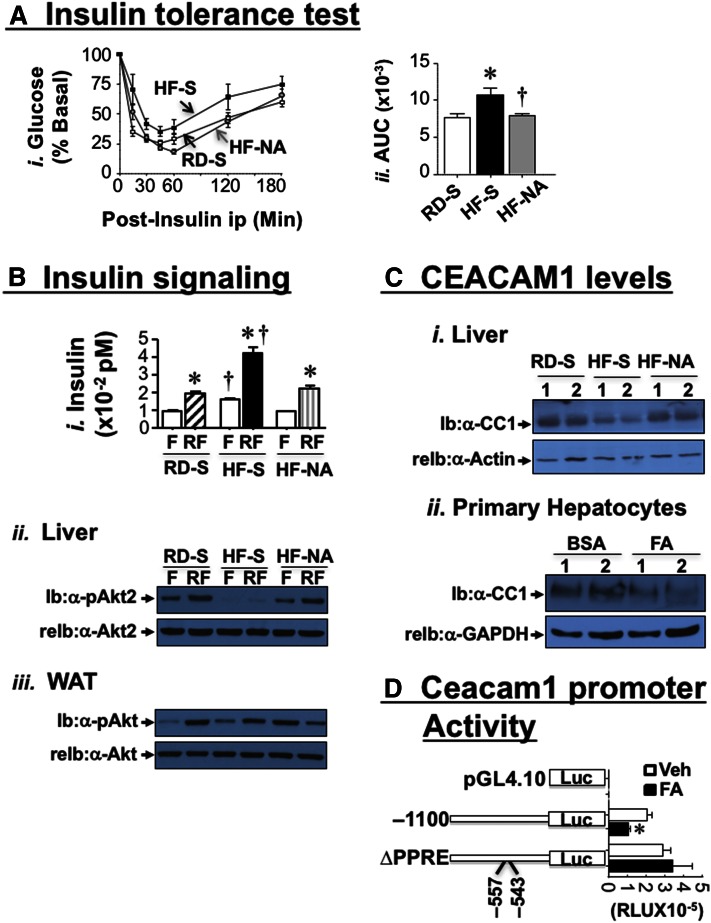
Fig. 2.
Effect of NA on metabolism and insulin signaling. A-i: RD-fed mice were injected with saline (RD-S, white square) and HF-fed mice with saline (HF-S, black square) or NA (HF-NA, gray circle) before intraperitoneal insulin tolerance test was carried out to measure glucose disposal at 0–180 min. ii: The AUC was calculated. n = 6–10 mice/feeding/treatment group. Values are expressed as mean ± SEM. * P < 0.05 versus RD-S (white bar); † P < 0.05 HF-NA (gray bar) versus HF-S (black bar). B: At the end of feeding/treatment period, mice were fasted overnight (F, white bar) and then refed (RF) for 7 h to measure plasma insulin level (i). Western analysis in liver (ii) and WAT lysates (iii) was carried out by immunoblotting (Ib) with α-phospho-Akt (α-pAkt) antibodies, followed by reimmunoblotting (re-Ib) with α-Akt antibody to normalize per total Akt loaded. Gels represent 2 independent experiments on 2 mice/feeding/treatment group. C-i: Liver lysates were analyzed by Western Blotting, probed with α-CEACAM1 (α-CC1), followed by α-Actin antibody. ii: Hepatocytes were isolated from WT mice and treated with either BSA or with BSA-coupled fatty acid mixture (FA) (0.1 mM), lysed, and analyzed by Western blot, using immunoblotting (Ib) with α-CC1, followed by α-GAPDH antibody for normalization. Gel represents three independent experiments. D: Constructs from the mouse promoter bearing the WT sequence from nt −1,100 to +30 or a block mutation of the only active PPRE/RXR site located between nt −557 and −543 were generated, subcloned into the pGL4.10 promoterless plasmid before their Luciferase activity in response to ethanol (Veh) (white bars) or FA (0.1 mM) (black bars) was determined in mouse Hepa1-6 cells. As a negative control, cells were transfected with the empty pGL4.10. The experiment was performed in quadruplet several times. Luciferase light units were expressed as mean ± SD in relative light units (RLU). The graph represents typical results from several separate experiments. * P < 0.05 versus Veh-treated cells (black vs. white bar per each construct).

