Figure 3.
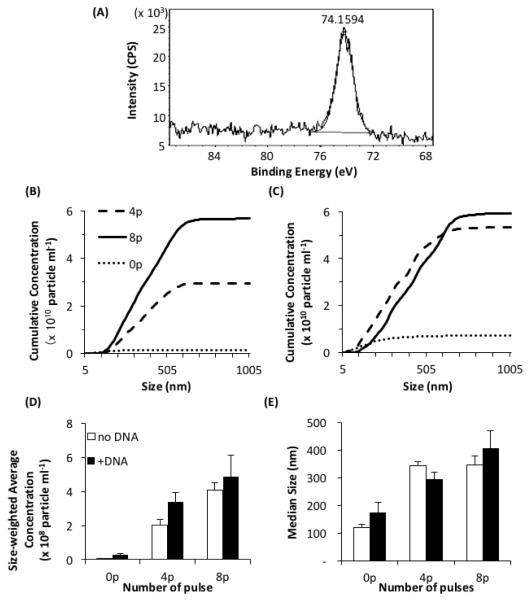
Characterization of precipitates in the HeBS buffer after being pulsed in aluminum cuvettes. (A) High-resolution XPS spectrum of the precipitates near the peak of binding energy for Al 2p. A dried pellet of precipitates was collected from pulsed buffer, and analyzed with XPS. The peak of the binding energy occurred at 74.2 eV. In Panels (B) through (E), the samples were pulsed 0, 4, or 8 times at 400 V cm−1, 5 ms duration and 1 Hz frequency, diluted 100 times, and analyzed by the nanoparticle tracking system. All data presented these panels are the means from three repeated experiments. Cumulative concentrations of the particles without and with pDNA are shown in (B) and (C), respectively. The size-weighted average concentrations and the median sizes of the particles are shown in (D) and (E), respectively. Open and solid bars represent data without and with pDNA, respectively. The bar and error bar represent the mean and the standard error of the mean (n = 3), respectively.

