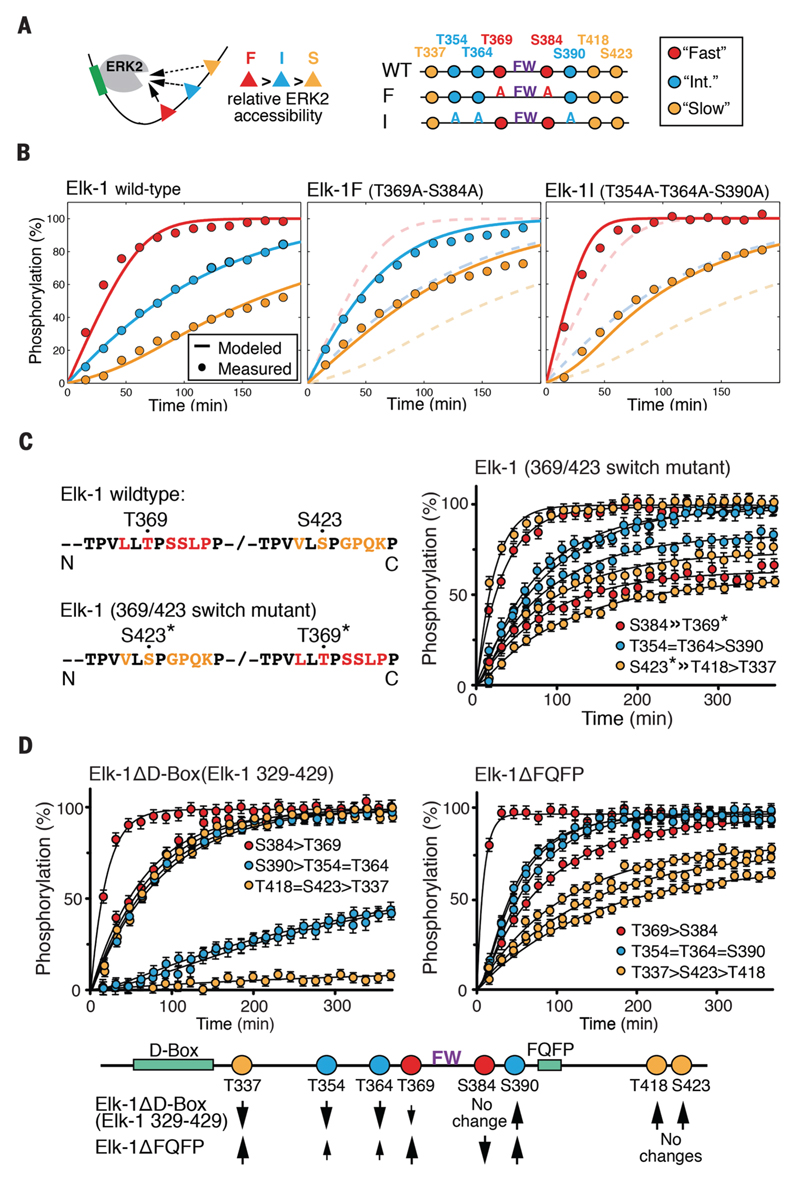
Figure 2. Phosphorylation kinetics of Elk-1 TAD mutants.
(A) Outline of analyzed Elk-1 TAD mutants. Substrate sites were classified as fast (red), intermediate (blue) or slow (yellow) for model calculations. (B) Left: comparison of averaged measured data points of wild-type Elk-1 TAD fast-, intermediate- and slow-site phosphorylation by ERK2 (circles) with calculated rates according to the competitive inhibition model (solid lines). Center: fast-site alanine-substituted Elk-1 TAD (Elk-1F); dashed lines show wildtype Elk-1 TAD for comparison. Right: intermediate-site alanine-substituted Elk-1 TAD (Elk-1I); dashed lines show wildtype Elk-1 TAD for comparison. (C) Time-resolved modification curves (right) of the Elk-1 369/423 switch mutant (left). Error bars denote differences between replicate experiments on two independent samples. (D) Time-resolved modification curves of ERK docking-site mutants Elk-1ΔD-box (left) and Elk-1ΔFQFP (right), presented as in (C). Effects of D-box and FQFP site deletions on Elk-1 TAD phosphorylation rates are summarised below.

