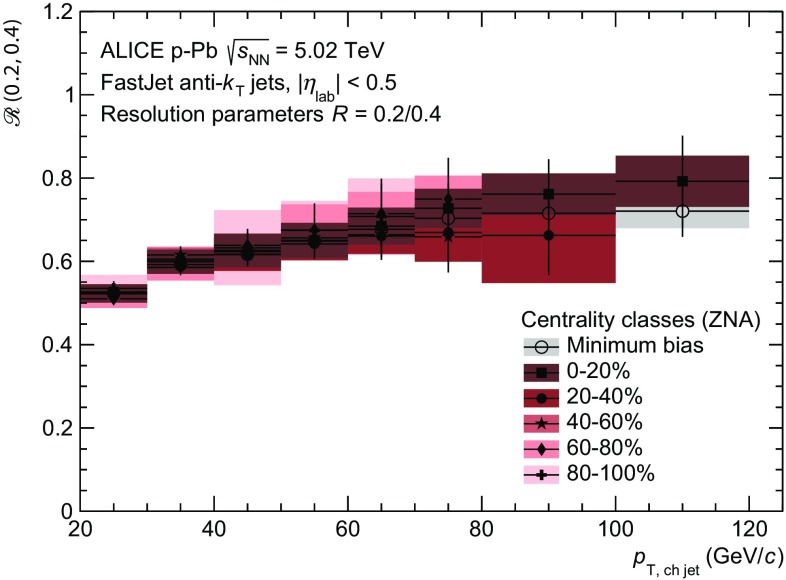
Fig. 6.
(Color online) Charged jet production cross section ratio for different resolution parameters as defined in Eq. 8. Different centrality classes are shown together with the result for minimum bias collisions. Note that the systematic uncertainties are partially correlated between centrality classes. The ratio for minimum collisions is compared in more detail to collisions at higher energy and NLO calculations at TeV in [25], where no significant deviations are found

