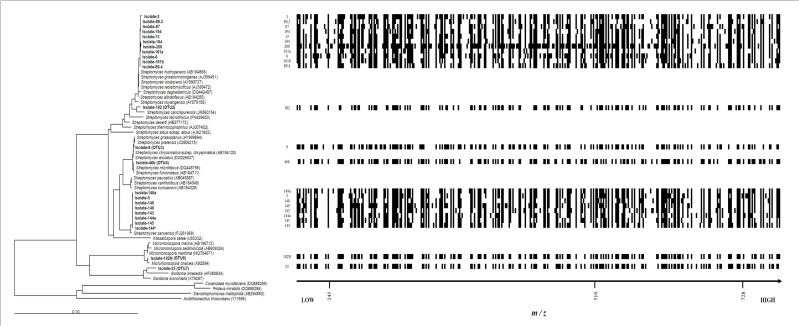
Fig 4. Barcoding vs. Phylogenetic tree.
Barcoding based on variables (retention time and m/z) displaying distinct metabolic profiles among the 24 Actinobacteria. Horizontal axis shows variables expressed as m/z values >200 of the 24 extracts. Each variable represents a single compound and its presence is represented by black squares and vertical axis shows each one of Actinobacteria strains according to phylogenetic tree.

