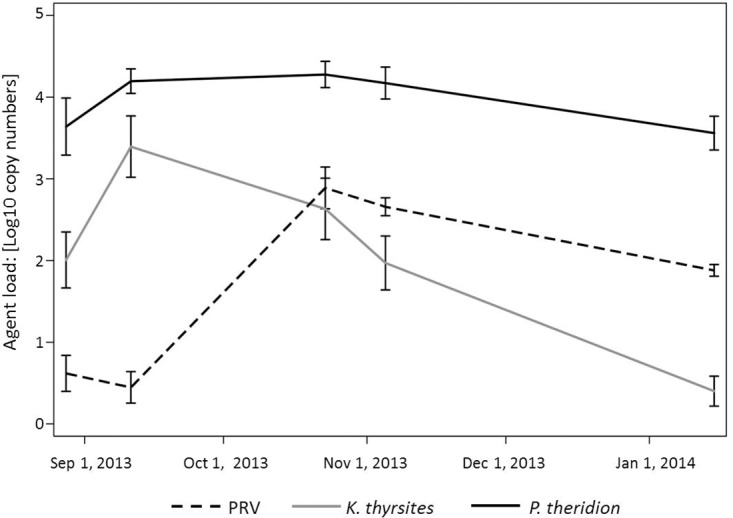
Fig 8. Mean pathogen load during the period (August 28th, 2013 –January 15th, 2014).

Line plots of mean pathogens loads in heart tissue over time (n = 38–42), as determined by qPCR method from the BioMark™ platform. Data are presented as copy numbers +1, calculated based on a standard curve and normalized into a logarithmic scale base 10. Error bars represent the standard error of the mean.
