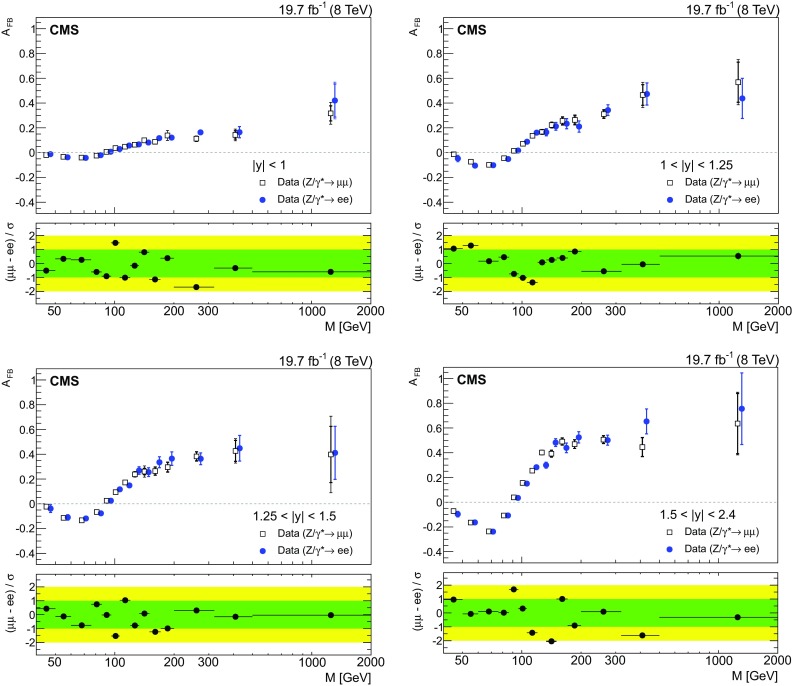
Fig. 3.

The unfolded distributions for muons (open squares) and electrons (solid circles) for the four central rapidity regions. The statistical (thick vertical bar) and statistical plus systematics (thin vertical bar) uncertainties are presented. The solid circles are shifted slightly to compare the result better. The lower panel in each plot shows the difference of the unfolded in muons and electrons divided by the total uncertainty (stat. syst.)
