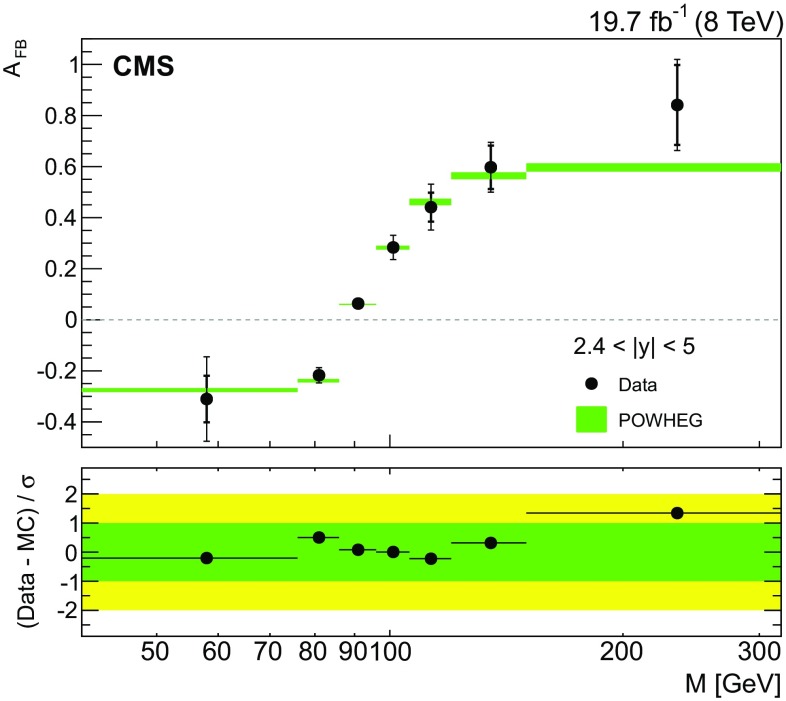
Fig. 5.
The unfolded distribution for the forward rapidity region () using one central electron () and one HF electron (). The inner thick vertical bars correspond to the statistical uncertainty and the outer thin vertical bars to the total uncertainties. The measurements are compared with the prediction of powheg. The total uncertainties (considering the statistical, PDF, and scale uncertainties) in the powheg prediction are shown as shaded bands. The lower panel shows the difference of in data and prediction divided by the total uncertainty of data and prediction

