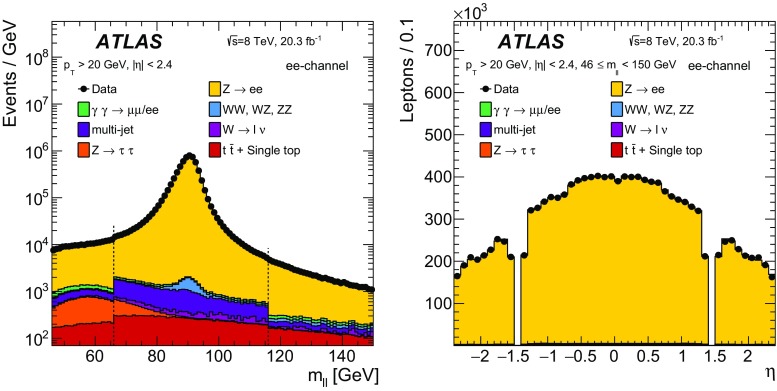
Fig. 1.
The distribution of events passing the selection requirements in the electron-pair channel as a function of dilepton invariant mass (left) and electron pseudorapidity (right). Events are shown for the range 46 to . The MC signal sample (yellow) is simulated using Powheg+Pythia. The statistical uncertainties on the data points are smaller than the size of the markers and the systematic uncertainties are not plotted. The prediction is normalised to the integral of the data. The vertical dashed lines on the left-hand plot at values of 66 and indicate the boundaries between the three principal regions employed in the analysis. The small discontinuities in the distribution at 66 and are due to the absence of the isolation requirement around the -boson mass peak

