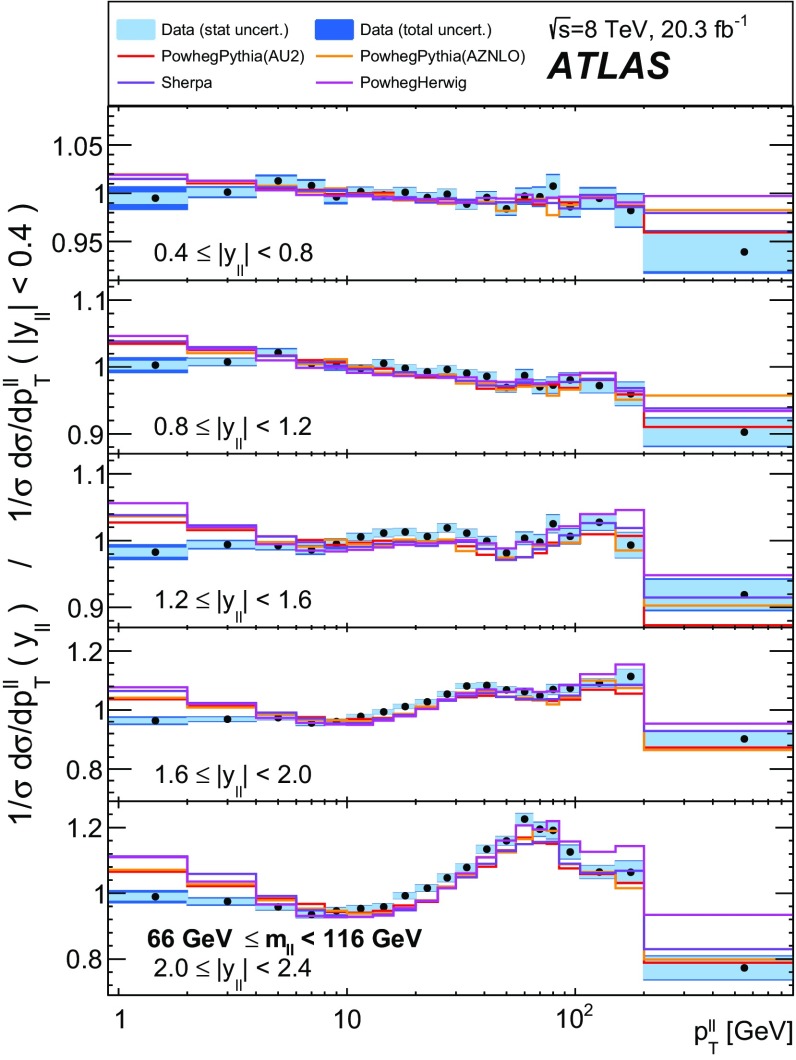
Fig. 16.
The distribution of at Born level in each region of , shown as a ratio to the central rapidity region (), for events at the -boson mass peak. The data, shown as points, are compared to the predictions of various MC generators. The light-blue band represents the statistical uncertainty on the data and the dark-blue band represents the total uncertainty on the data (treating systematic uncertainties as uncorrelated between regions of )

