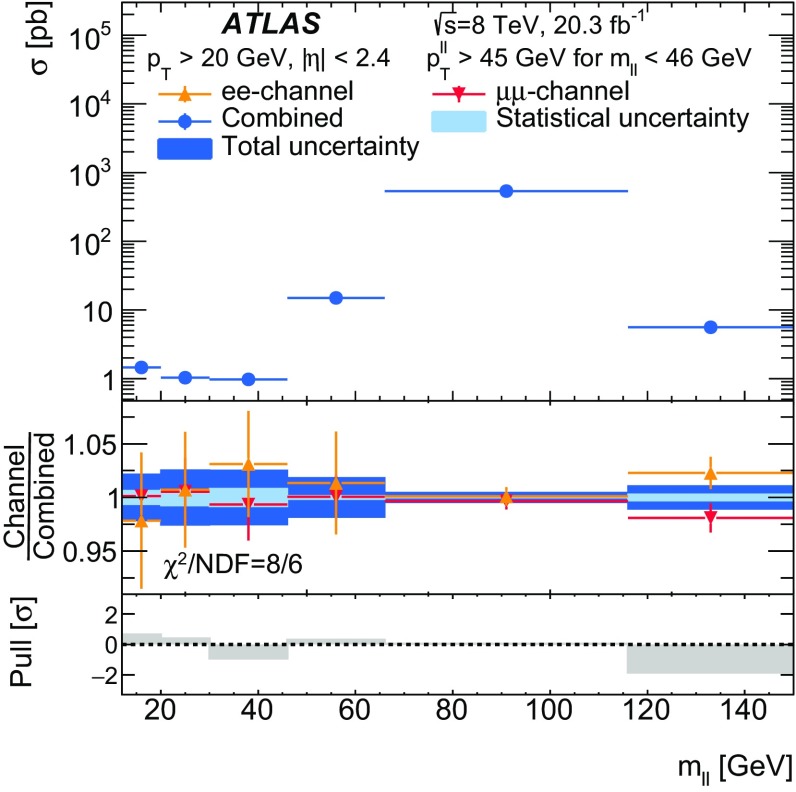
Fig. 7.
Born-level fiducial cross sections in bins of for the combination of the electron-pair and muon-pair channels. The middle plot shows the ratios of the values from the individual channels to the combined values, where the error bars on the individual-channel measurements represent the total uncertainty uncorrelated between bins. The light-blue band represents the data statistical uncertainty on the combined value. The dark-blue band represents the total uncertainty (statistical and systematic), except for the uncertainty of 2.8 % on the integrated luminosity, which is fully correlated between channels and among all bins. The per degree of freedom is given. The lower plot shows the pull, defined as the difference between the electron-pair and muon-pair values divided by the uncertainty on that difference. The fiducial regions to which these cross sections correspond are specified in Table 1. Note that is required to be greater than for

