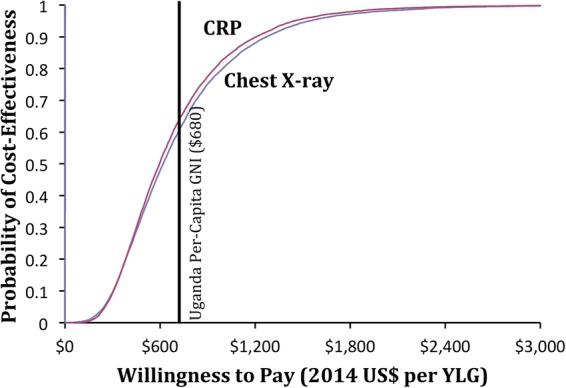
Figure 2.

Cost-effectiveness acceptability curve for tuberculosis triage testing. The curve shows the probability of cost-effectiveness of triage testing with chest X-ray (CXR, blue) or C reactive protein (CRP, red) over 10 000 Monte Carlo simulations. The vertical black line indicates the per capita gross national income of Uganda. YLG, year of life gained.
