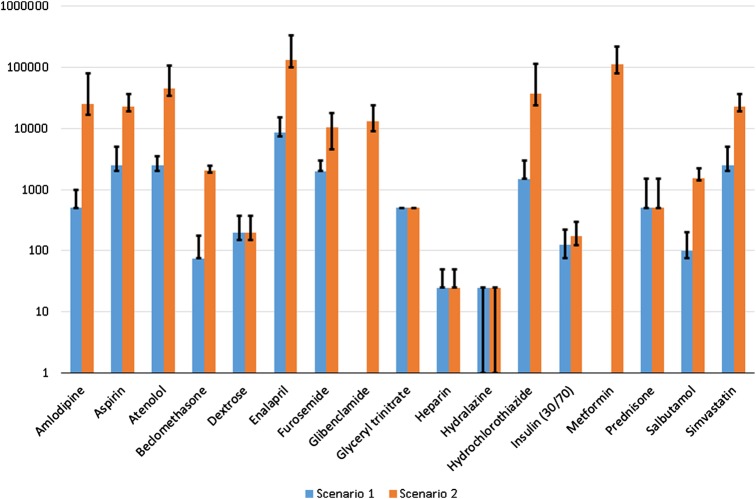
Figure 2.
Medicine requirements by scenario. The Y-axis uses a logarithmic scale to show the median number of units of each medication required for each scenario. The top of the black bars show the maximum number of units required for any one of the included countries. The bottom of the black bars show the minimum number of units required for any one of the included countries.

