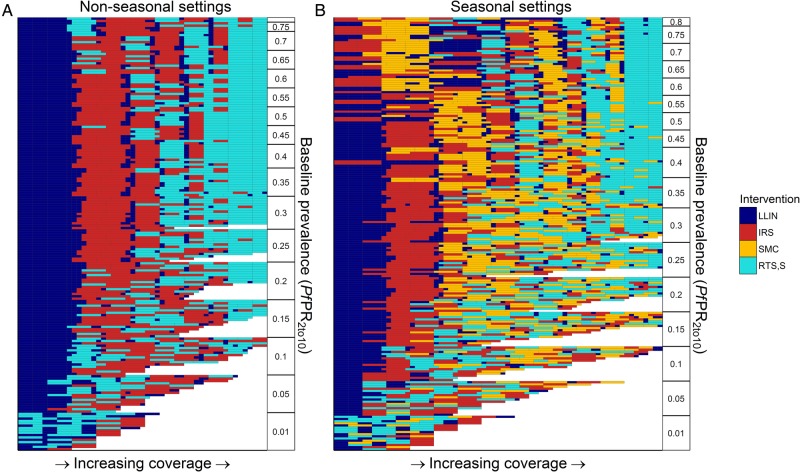
Figure 4.
Costs-effective scale-up pathways with non-linear costs. Each row represents a cost-effective scale-up pathway for a specific transmission setting (baseline PfPR2_10, seasonal profile, vector profile, intervention correlation) ordered by PfPR2_10 on the y-axis. Interventions are scaled-up in the order reading along the row from left to right, the fill colour representing the intervention being scaled-up. Panels split the output into (A) non-seasonal settings and (B) seasonal settings, with the latter including seasonal malaria chemoprevention as an option.

