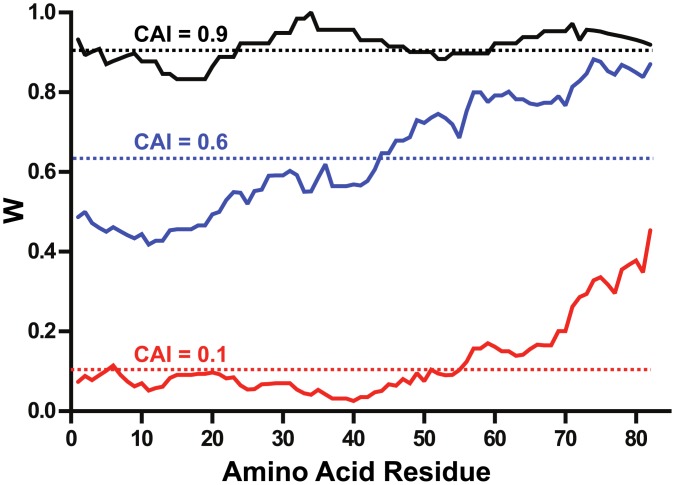
Fig 1. Optimization of the vpu gene for expression in E. coli.
Codon usage is presented by plotting the relative adaptiveness, w, values (a moving geometric mean with a 10-residue window) as a function of the residue number. Codon usage analysis of the native HIV-1 Vpu gene against the reference set of E. coli and H. sapiens are shown as red and blue traces. The codon usage of the vpu gene optimized for expression in E. coli is shown in black. The codon adaptation index (CAI, relative adaptiveness averaged over the entire length of a sequence) for each gene is shown as a broken line.

