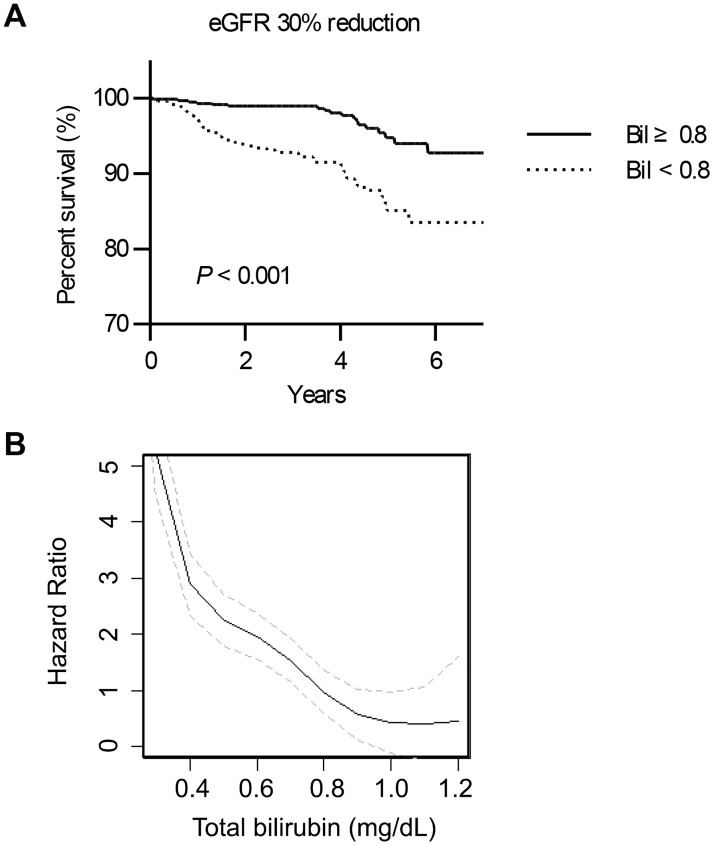
Fig 2. The renal outcome of the study patients.
A) Kaplan-Meier survival curves of renal survival in terms of the primary outcomes. The x-axis shows the duration from the coronary CT angiography scan by years, and the y-axis shows the percent survival. B) Penalized spline models reveal the relationship between the baseline total serum bilirubin levels and the risk of primary outcomes. The linear line indicates the hazard ratio curve according to the bilirubin levels, and the gray broken lines above and below the linear line indicate the 95% confidence interval of the hazard ratio. The vertical dotted gray line indicates the serum bilirubin level of 0.8 mg/dL, which is the cut-off value for the study group in the current study.

