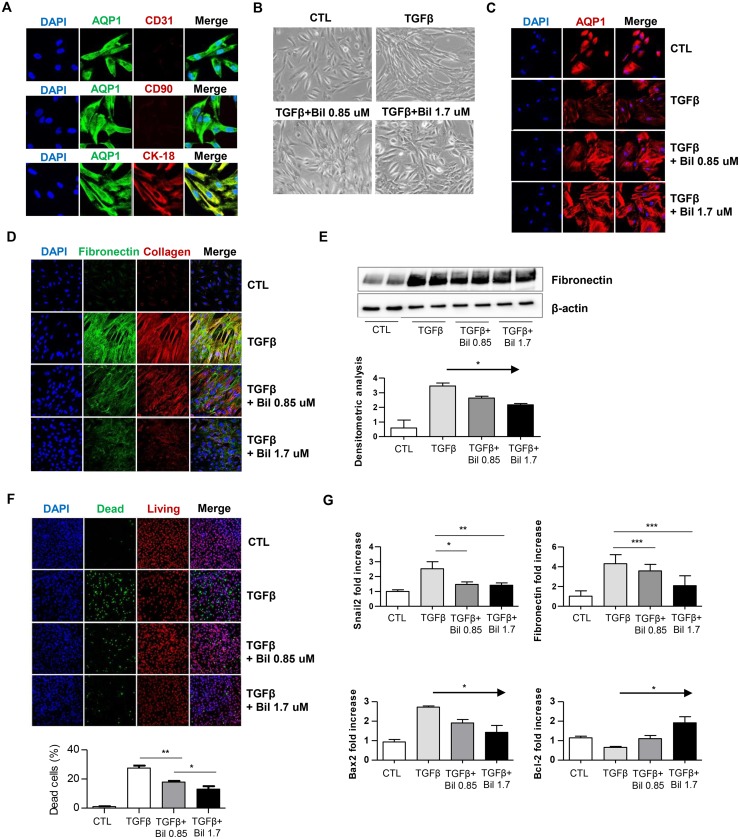
Fig 4. In vitro study with hTECs.
A) Representative images of hTEC identification by immunofluorescence staining for CD31 as the endothelial cell marker, CD90 as the mesangial cell marker, and CK-18 as the proximal tubular cell marker. B) Representative differential interference contrast images of hTECs showing the morphological changes in hTECs cultured with rTGF-β in the presence or absence of bilirubin. Upper left picture: control group; upper right picture: hTECs cultured with rTGF-β; lower left picture: hTECs cultured with rTGF-β and 0.85 μmol/L bilirubin; lower right picture: hTECs cultured with rTGF-β and 1.7 μmol/L bilirubin. C) Representative immunofluorescence images of hTECs stained with AQP1. D) Representative immunofluorescence images of hTECs stained with DAPI, fibronectin and collagen 1. E) Western blot immunoassay for fibronectin and β-actin. F) Representative images of cell integrity assay. Live red dye for permeant cell membrane which marks both for live and dead cells, dead green dye for impermeant cell outer membrane and stains only cells with disrupted integrity G) Quantitative real-time PCR results for fibronectin, Snail2, Bcl-2, and Bax2. CTL, control, Bil, bilirubin.*P < 0.05, **P < 0.01, ***P < 0.005. Each condition was evaluated in triplicate, and this figure represents one of three independent experiments.

