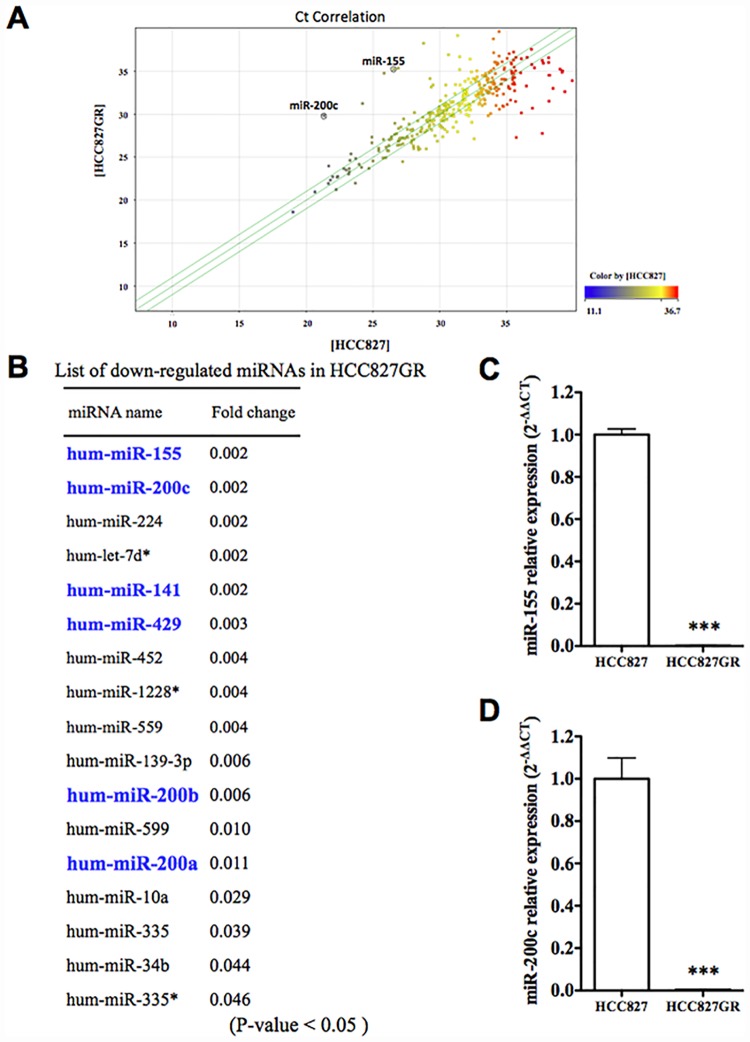
Fig 1. miRNA expression analysis using microarrays.
(A) Pearson’s correlation scatter plot of miRNA levels between HCC827 and HCC827GR cells. (B) List of down-regulated miRNAs in HCC827GR cells compared to HCC827 cells (fold change of p<0.05). (C,D) qRT-PCR for miR-155, miR-200c and RNU44, an internal standard, in HCC827 cells and HCC827GR cells (***p<0.001 vs. HCC827 cells).

