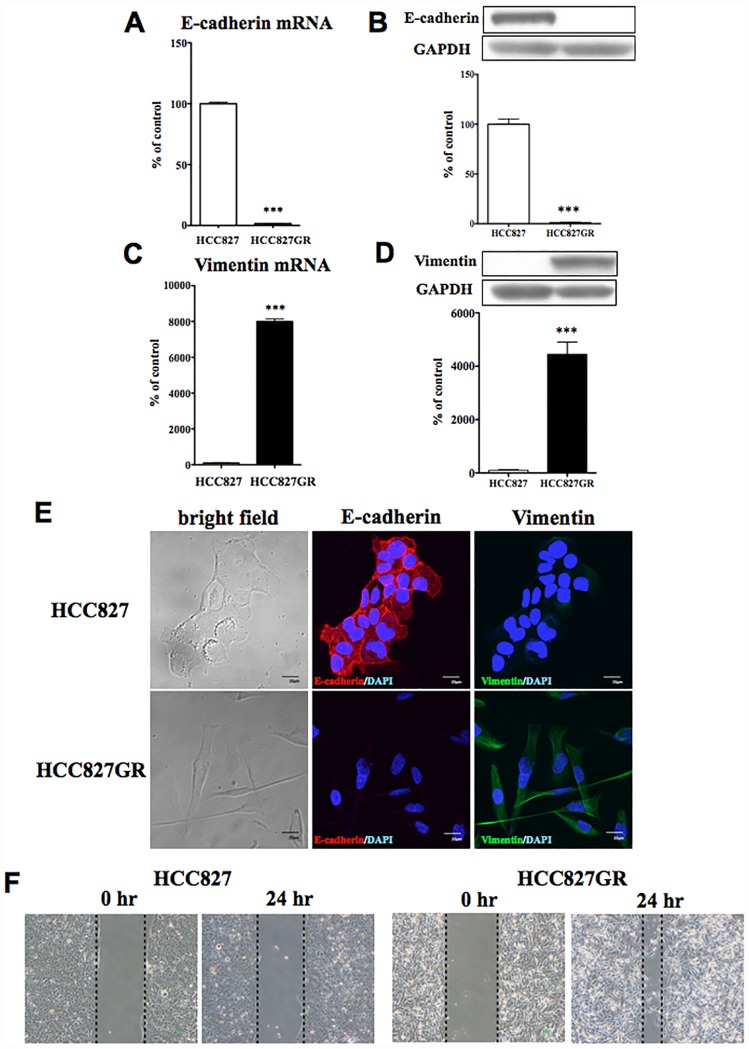
Fig 4. Epithelial-to-mesenchymal transition by chronic in vitro treatment with gefitinib.
(A,C) The mRNA expression levels of E-cadherin (A) and vimentin (C) were quantified by qRT-PCR in HCC827GR cells compared to HCC827 cells (***p<0.001 vs. HCC827 cells). (B,D) The protein levels of E-cadherin (B) and vimentin (D) were quantified by western blots in HCC827GR cells compared to HCC827 cells. Upper: Representative western blots of E-cadherin (B) and vimentin (D) in cell lysate fraction of HCC827GR cells. Data represent the mean with S.E.M. of 3 independent samples (***p<0.001 vs. HCC827 cells). (E) Immunofluorescent staining for E-cadherin or vimentin in HCC827 and HCC827GR cells. Representative phase-contrast images of HCC827 and HCC827GR cells showing characteristic differences in cell morphology (left). Immunofluorescence staining of E-cadherin (red), an epithelial marker, and DAPI (blue) to identify nuclei, in HCC827 and HCC827GR cells (middle). Immunofluorescence staining of vimentin (green), a mesenchymal marker and DAPI (blue) in HCC827 and HCC827GR cells (right). (F) Wound healing assay in HCC827 and HCC827GR cells. Representative phase-contrast images of HCC827 and HCC827GR cells show characteristic differences in cell migration.

