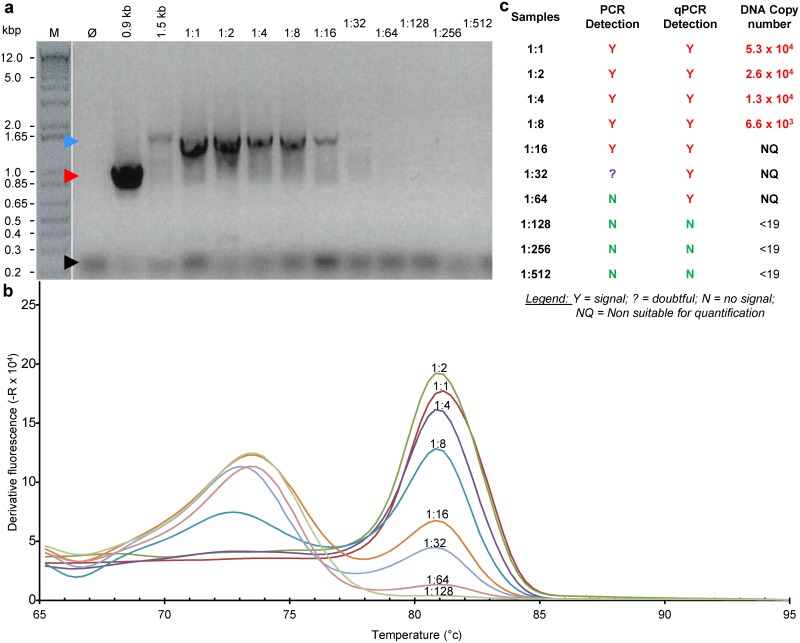
Fig 3. Relative sensitivity of qPCR and PCR using parameters optimized for qPCR.
(a) PCR product imaging after electrophoresis on agarose gel and staining. (b) Melting curves of qPCR samples (c) Table summarising data illustrated in (a) and (b). A cell culture supernatant known to be contaminated by mycoplasma was serially diluted and a sample of each dilution was run on qPCR. At the end of the qPCR run, the obtained qPCR product from each sample was analysed on agarose gel as standard PCR products.

