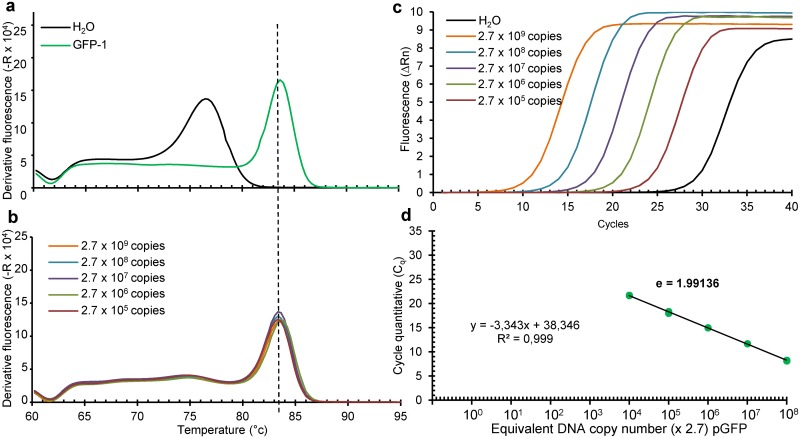
Fig 5. Melting curves and amplification plots of GFP DNA amplicons resulting from PCR using GFP.
Melting curves obtained using p_GFP (a), their reproducibility over multiple quantification runs (b) with the amplification plot (c), and the linear regression analysis of Cq as a function of DNA copy input number (d, efficacy EGFP = 1.99136) Tm peak of GFP amplicon is indicated by the dotted line. For (c) and (d), dilutions were done from a freshly prepared 99 bp PCR amplicon obtained from 5 pg of p_GFP using running conditions depicted in Table 2 with DNA concentration measured by NanoDrop™ (http://www.nanodrop.com/).

