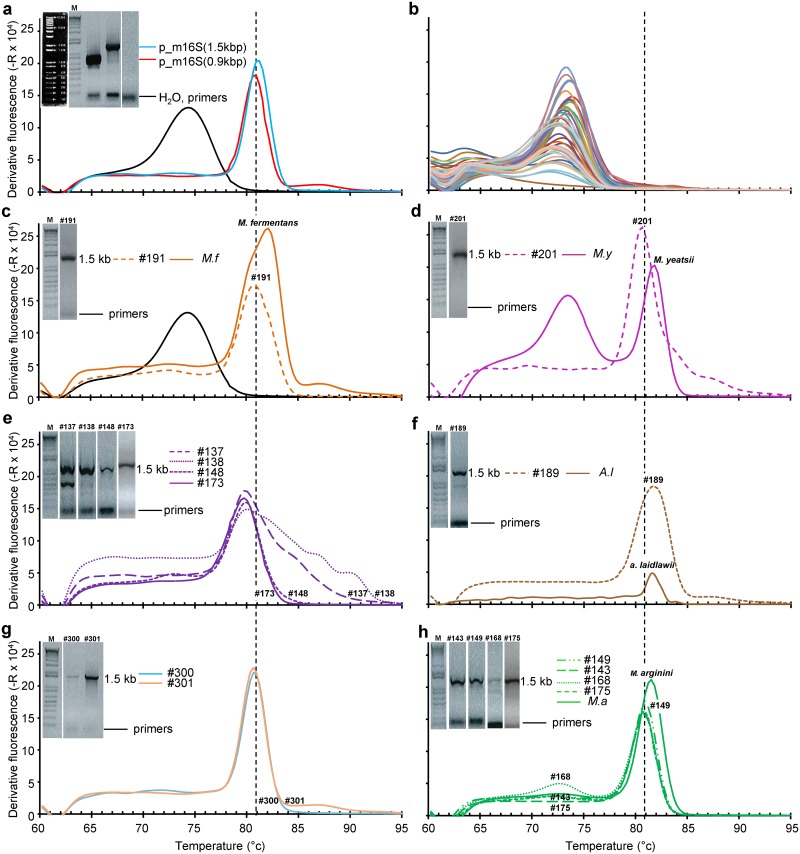
Fig 6. Dissociation curves of m16S qPCR and amplicon size (insets) of DNA samples from cell-free supernatants and/or virus stocks and comparison with DNA from mycoplasma cultures when available with controls (a), samples (# follow by number) without detectable mycoplasma 16S rDNA (b) M. fermentans, (c), sample(s) with contaminated M. yeatsii (d) M. hyorhinis (e), A. laidlawii, (f), M. cottewii (g) and M. arginini (h).
For sake of clarity, only corresponding amplicons run on agarose gel electrophoresis are shown in the inset with the 1 kb ladder markers (11, 10, 9, 8, 7, 6, 5, 4, 3, 2, 1.65, 1, 0.85, 0.65, 0.6, 0.4, 0.3, 0.2 and 0.1 kb dsDNA) shown lane M in (a). Tm peak of 16S rDNA amplicon is indicated by the dotted line on each graph.

