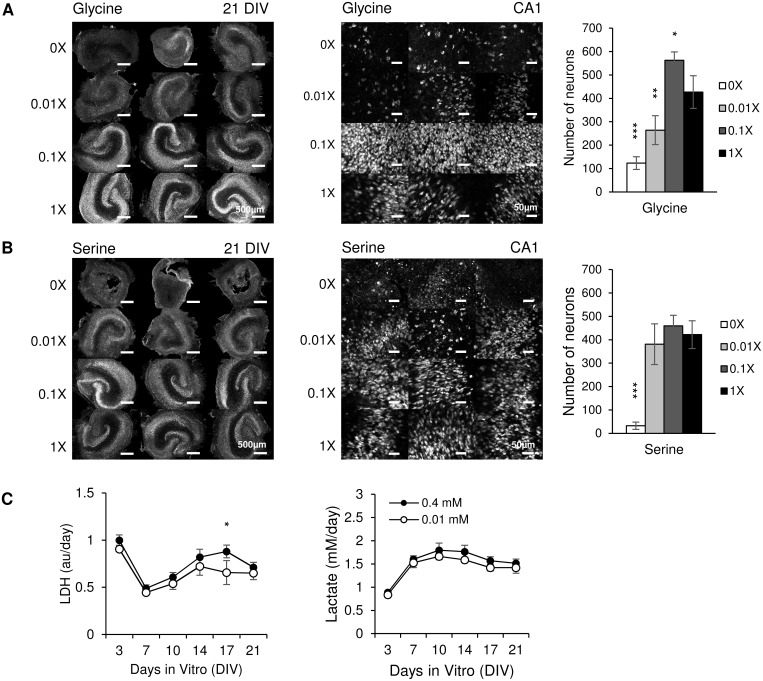
Fig 6. Cultures in media with different glycine and serine concentrations.
(A) Left: low magnification confocal images of NeuN staining in cultures at 21 DIV, glycine concentrations are indicated on left side of images, scale bars, 500 μm; Middle: representative confocal images of NeuN staining in CA1, scale bars, 50μm; Right: corresponding CA1 neuron counts; n = 3 cultures, each condition. Statistical differences are indicated for comparisons between 1x group versus other groups. (B) Cultures maintained in different concentrations of serine. Significances are indicated for 0x group versus 1x group; n = 3 cultures, each condition. (C) Lactate and LDH results for cultures treated with combined glycine and serine, n = 3 cultures, each condition. Error bars represent SD. Significant differences are labeled as *p < 0.05, **p < 0.01 and ***p < 0.001.

