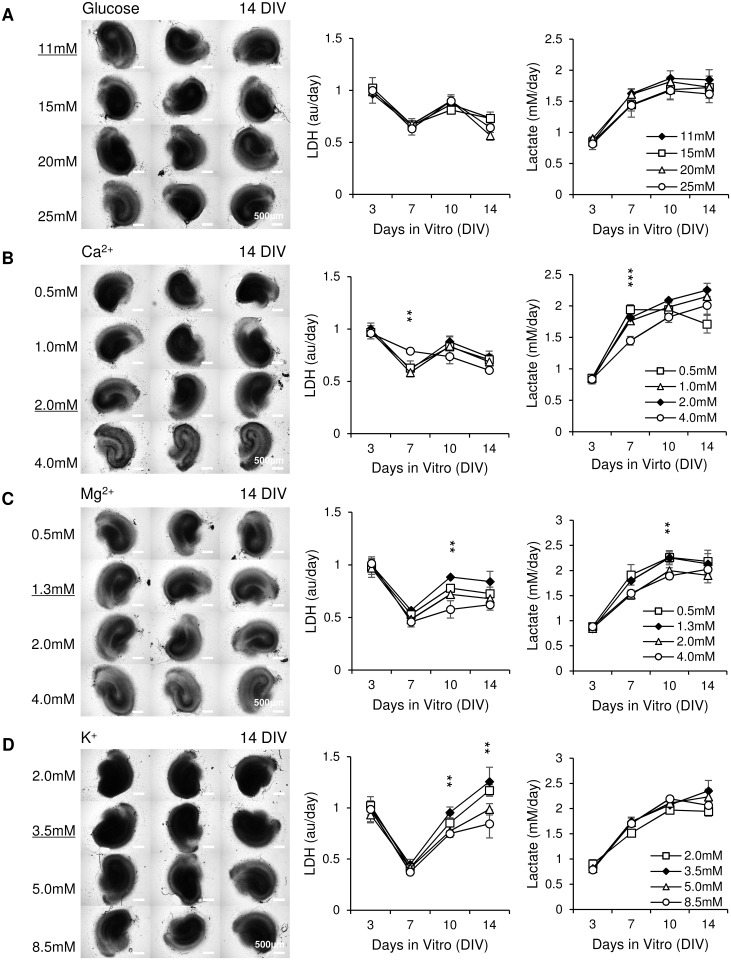
Fig 7. Modification of glucose and electrolyte concentrations affects cell survival and ictal activity.
(A-D) Left: brightfield images of cultures maintained in media with indicated concentrations of glucose, Ca2+, Mg2+, or K+ at 14 DIV, scale bars, 500 μm; Right: time course of LDH and lactate release into culture medium. n = 3 cultures, each condition. Error bars indicate SD. Concentrations of ions that correspond to rat CSF are underlined and indicated by solid symbols. Significant statistical differences are indicated for comparison of 4 mM Ca2+, 4 mM Mg2+ and 8.5 mM K+ versus CSF concentrations of corresponding ions., with **p < 0.01 and ***p < 0.001.

