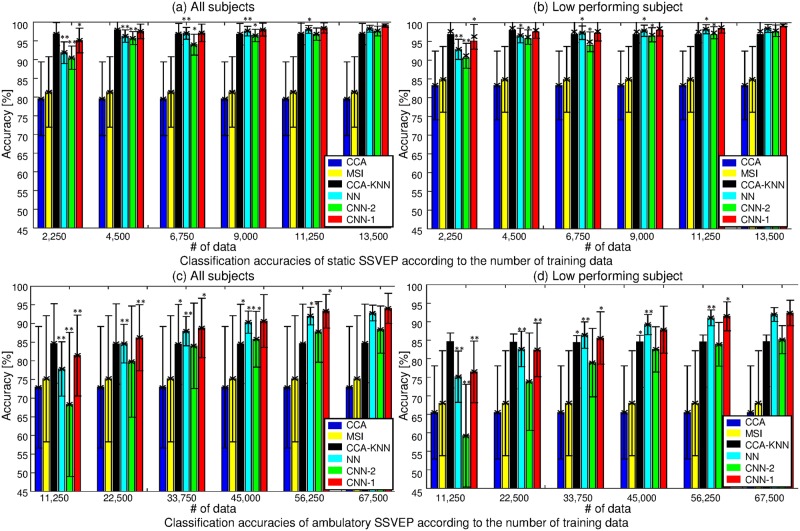
Fig 7. 10-fold cross-validation performance comparison using static (top) and ambulatory SSVEP (bottom) as the number of training data increases.
(a) Average of all subjects in static SSVEP. (b) Low performing subjects. 1,500 test data were used for each fold. One asterisk indicates indicates the 5% significance level between corresponding to the number of training data samples and 13,500 training data samples. Two asterisks are the 1% significance level. (c) Average of all subjects in ambulatory SSVEP. (d) Low performing subjects. 7,500 test data were used for each fold. One asterisk indicates indicates the 5% significance level between the corresponding number of training data samples and 67,500 training data samples. Two asterisks are the 1% significance level.

