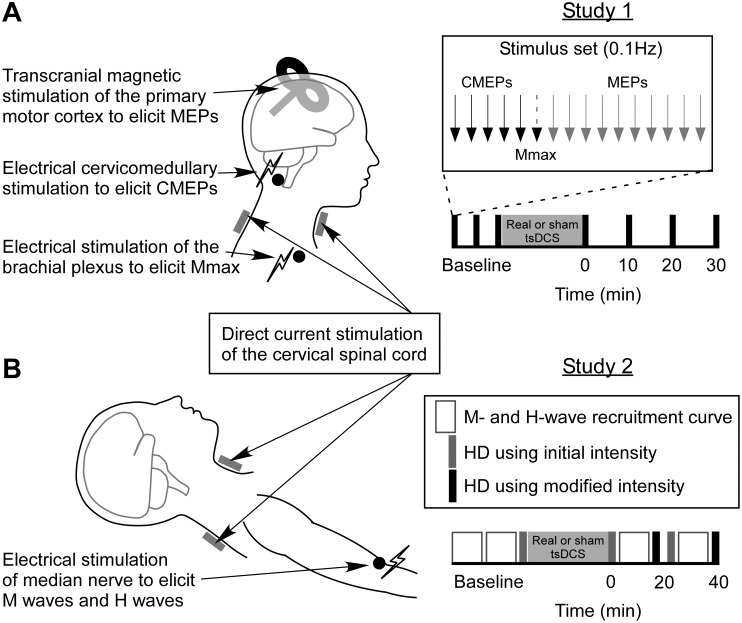
Fig 1. Stimuli and protocols.
In Studies 1 and 2, 20 min of real or sham cervical transcutaneous spinal direct current stimulation (tsDCS) was applied through saline soaked sponge electrodes placed anteriorly below the cervicomental angle, and posteriorly over the spinous process of C7. Real tsDCS involved an initial ramping-up of intensity over 30 s, followed by stimulation at 3 mA for the remainder of the 20 min, whereas sham tsDCS involved an initial ramping-up of intensity over 30 s, 1 min of stimulation at 3 mA, then no stimulation for the remainder of the 20 min. In Study 1 (A), participants sat upright with their right arm relaxed on a pillow on their lap. Transcranial magnetic stimulation (TMS) over the primary motor cortex was used to elicit motor evoked potentials (MEPs) in the biceps brachii, flexor carpi radialis (FCR) and first dorsal interosseous (FDI) muscles. Cervicomedullary stimulation was used to directly activate corticospinal axons at the pyramidal decussation, producing cervicomedullary motor evoked potentials (CMEPs) in biceps and FCR. Electrical stimulation of the brachial plexus was used to elicit maximal compound muscle action potentials (Mmax) in the biceps, FCR and FDI. Three baseline sets of stimuli (5 CMEPs, 1 Mmax and 10 MEPs delivered at 0.1Hz) were delivered prior to real or sham tsDCS, with 5 min between the start of each set. Test sets of stimuli were then delivered at 0, 10, 20 and 30 min after real or sham tsDCS. In Study 2 (B), participants were supine with their right arm out to the side at 45 degrees shoulder abduction, elbow slightly bent, with the palm facing upwards. Electrical median nerve stimulation was used to elicit M waves and H reflexes in the FCR. M-wave and H-reflex recruitment curves were recorded and homosynaptic depression was measured before and after real or sham tsDCS. For baseline measurements, two recruitment curves were recorded, and then one set of stimuli for HD (at intensity for 50% of Hmax). At T1 (0–20 min) and T2 (20–40 min) after real or sham tsDCS, an initial set of stimuli for HD was delivered at the same intensity used for baseline measurements. A recruitment curve was then recorded, and if the stimulus intensity for 50% of Hmax was different to that measured during baseline recordings, a new set of stimuli for HD was delivered at a modified intensity.

