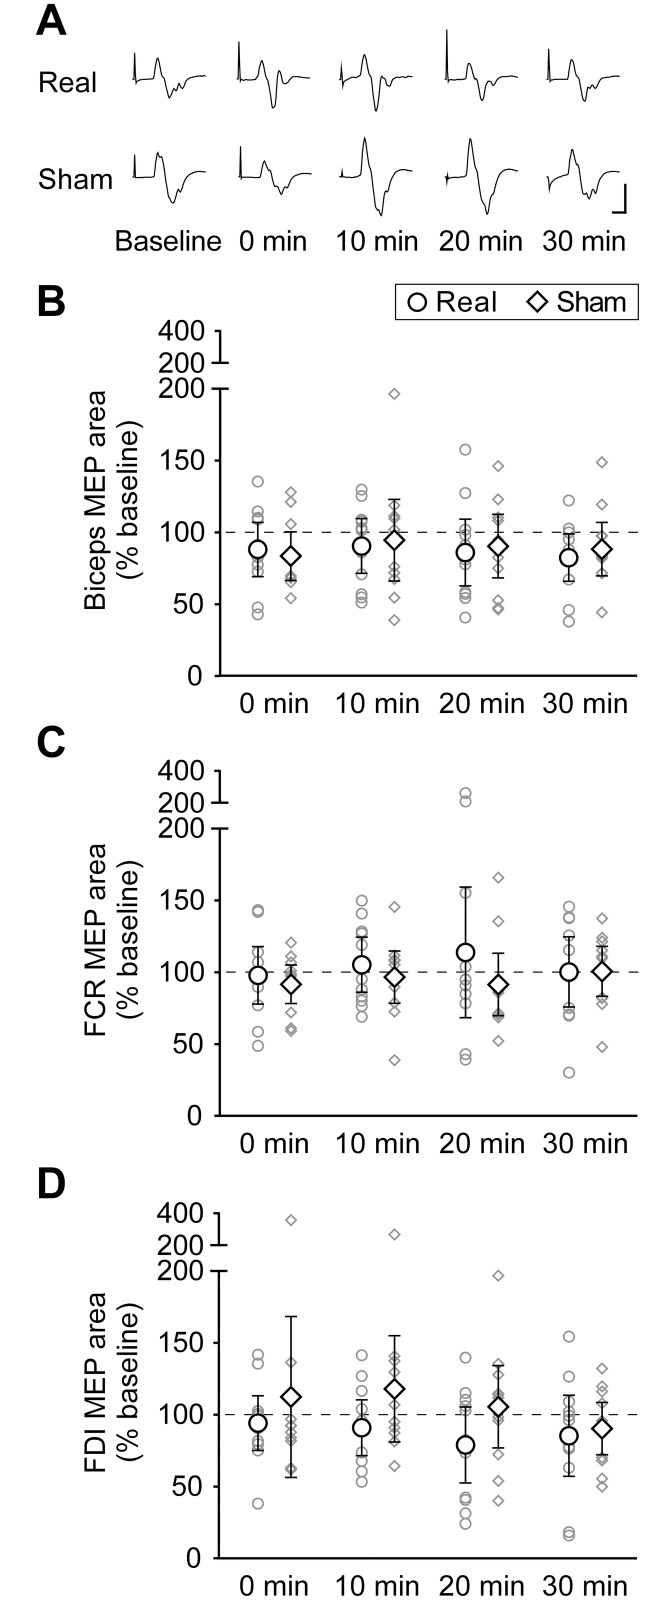
Fig 4. Muscle responses to transcranial magnetic stimulation of the primary motor cortex before and after real or sham tsDCS.
(A) Averaged biceps brachii MEPs (10–30 traces) for a single participant elicited before (Baseline) and at 0, 10, 20, and 30 min after real or sham tsDCS. No major differences can be observed between responses measured before and after real or sham interventions. Calibration: vertical, 0.1 mV; horizontal, 10 ms. Biceps (B), FCR (C) and FDI (D) MEP areas are normalised to Mmax and expressed as a percentage of baseline values. Both group means (n = 11; ◯ = tsDCS; ◇ = sham) and individual data (smaller grey symbols) are represented at 0, 10, 20 and 30 min after real or sham tsDCS. Error bars are 95% CIs. For all three muscles, there are no significant changes in MEP size over time, and there are no significant differences between real and sham interventions.

