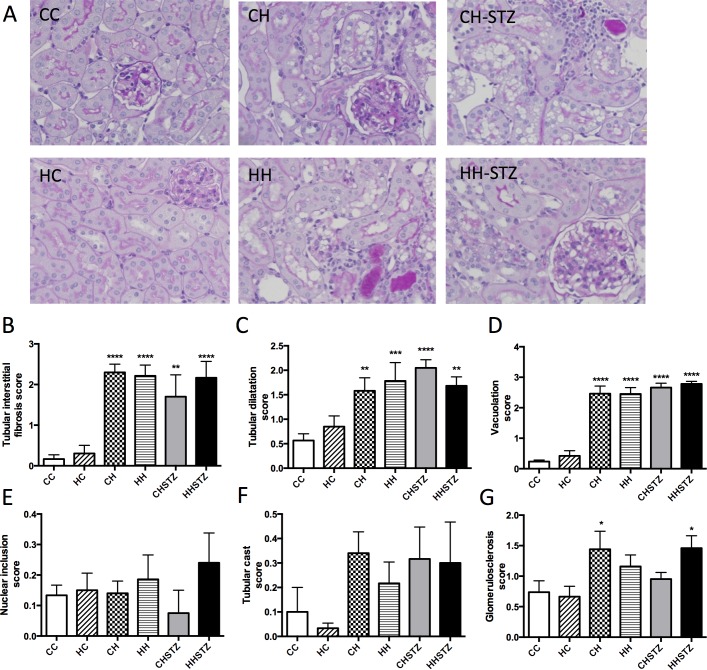
Fig 5. Renal structural changes at Week 32.
A. Periodic acid Schiff staining (PAS) representative image at 400x magnification, B. Interstitial fibrosis score, C. Tubular dilatation score, D. Tubular vacuolation score, E. Nuclear inclusion body score, F. Tubular cast score, G. Glomerulosclerosis score. Results are expressed as mean ± SEM, N = 6–7. *P< 0.05, **P<0.01, ***P<0.001, ****P<0.0001 compared to CC.

