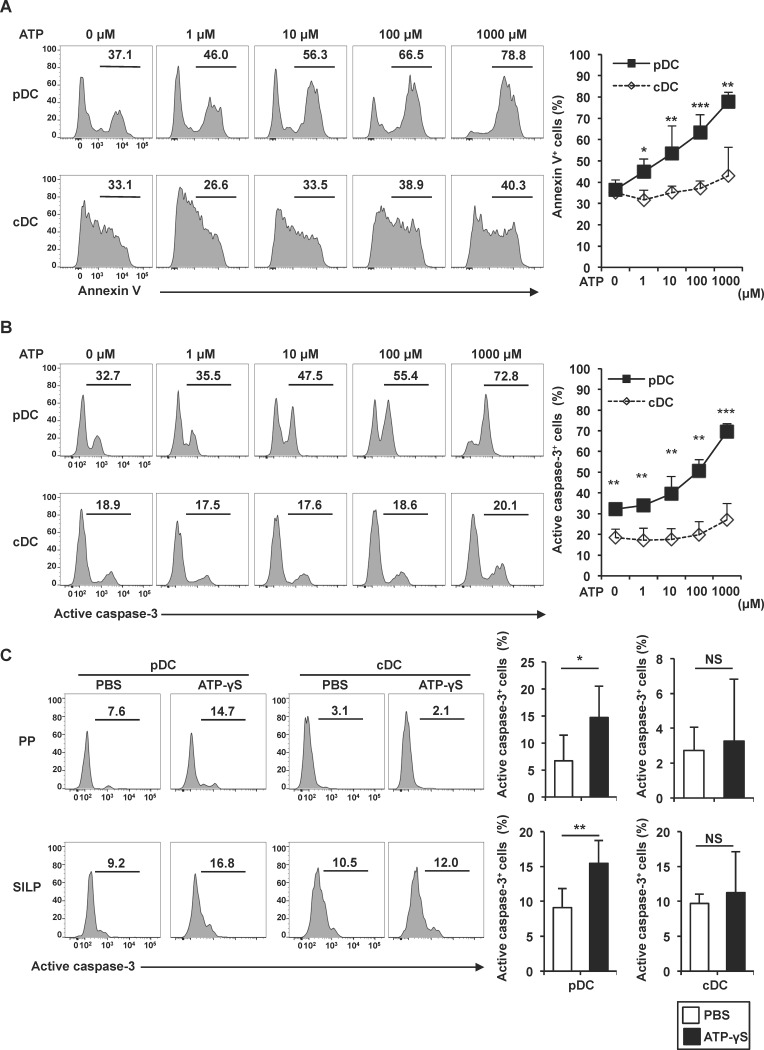
Fig 3. Enhancement of ATP-induced apoptosis of pDCs.
(A, B) Cells isolated from MLNs were treated with the indicated concentrations of ATP for 3 h. Annexin V-positive cells (A) and active caspase-3-positive cells (B) among PDCA-1+ CD11cmed pDCs and PDCA-1- CD11chigh cDCs were analyzed by flow cytometry. Representative histograms are shown (left) and the means ± SD (n = 3) of the percentages of annexin V-positive (A) and active caspase-3-positive cells (B) are shown (right). *p < 0.05, **p < 0.01, ***p < 0.001. (C) Frequency of active caspase-3-positive cells among CD45+ PDCA-1+ CD11cmed pDCs and and PDCA-1- CD11chigh cDCs from the PPs and SILP of mice injected with 300 μl PBS (n = 6) or 1 mM ATP-γS (n = 5) into their small intestinal lumen. Representative histograms are shown (left) and the means ± SD of the percentages of positive cells are shown (right). *p < 0.05, **p < 0.01, NS: not significant.

