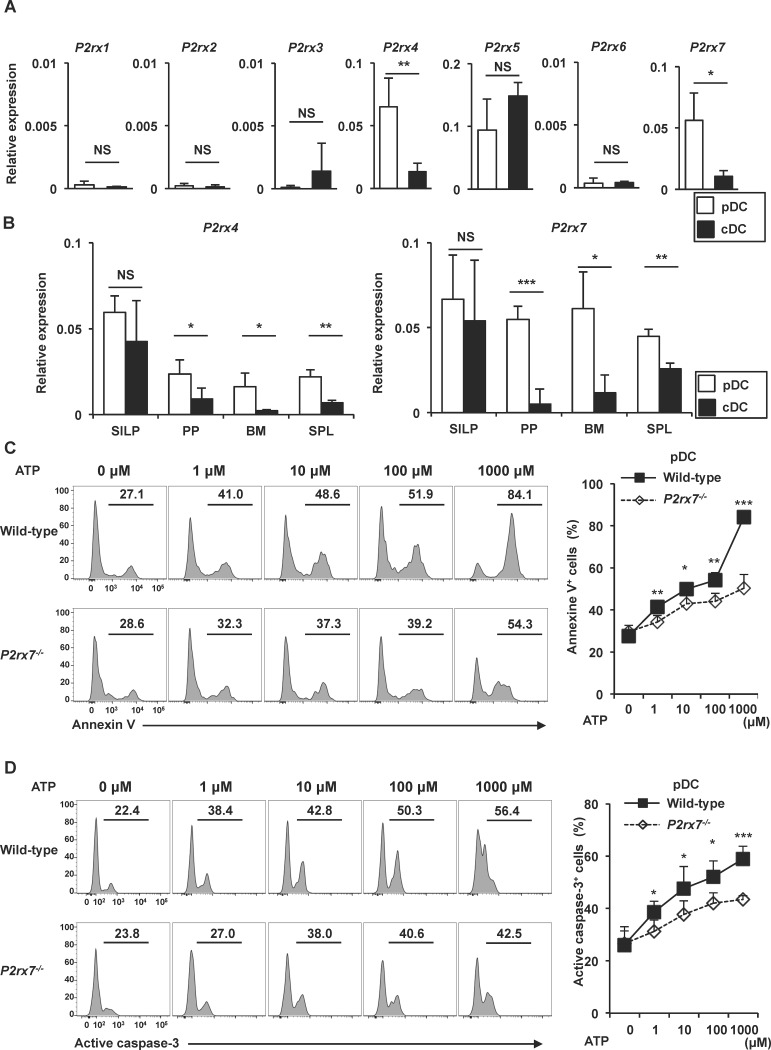
Fig 4. P2X7-dependent induction of pDC apoptosis in vitro.
(A) Expression of P2X receptors in pDCs or cDCs of MLN was analyzed by quantitative RT-PCR. Data are means ± SD (n = 3). *p < 0.05, **p < 0.01. (B) mRNA expression of P2rx4 and P2rx7 in pDCs and cDCs of SILP, PP, bone marrow (BM) and spleen (SPL) was analyzed by quantitative RT-PCR. Data are means ± SD (n = 3). *p < 0.05, **p < 0.01. (C, D) Isolated MLN pDCs of wild-type and P2rx7-/- mice were treated with the indicated concentrations of ATP for 3 h. Annexin V-positive cells (C) and active caspase-3-positive cells (D) were analyzed by flow cytometry. Representative histograms are shown (left) and the means ± SD of the percentages of annexin V-positive (C) and active caspase-3-positive cells (D) (n = 4) are shown (right). *p < 0.05, **p < 0.01, ***p < 0.001.

