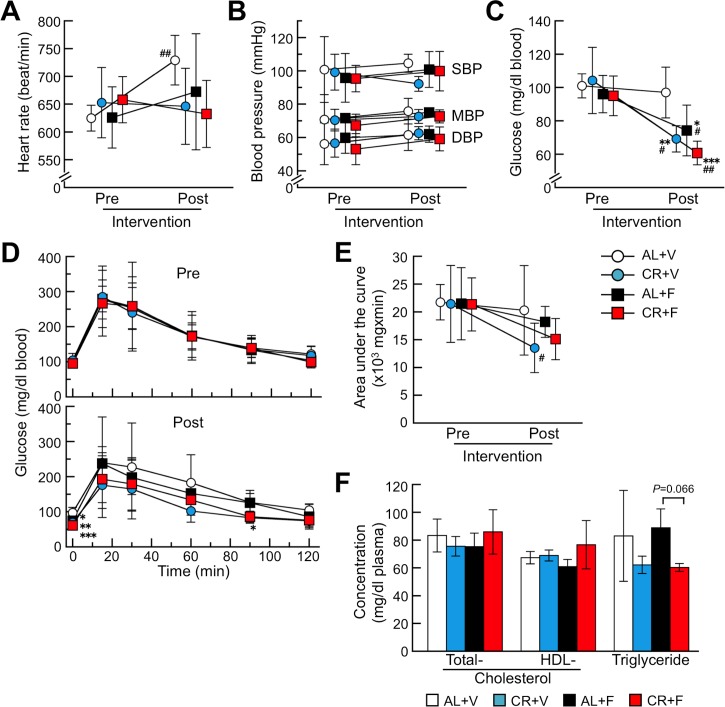
Fig 3. CR treatment might improve glucose metabolism.
These panels show the heart rates (A), blood pressures (B), fasting blood glucose levels (C) and changes of blood glucose and areas under the curve determined by the IGTT (D and E, respectively) before (pre) and after (post) the intervention. Values of plasma lipids after the intervention were shown in (F). Each symbol or column and bar represents the mean ± S.D. (N = 6 (CR+F) and 5 (others)). None of the baseline (pre) parameters were significantly different among the four groups (Tukey-Kramer method). *p<0.05, **p<0.01, ***p<0.001 vs. the AL+V group (Tukey-Kramer method for multiple comparison at corresponding time). #p<0.05, ##p<0.01 vs. the each baseline (paired Student’s t test).

