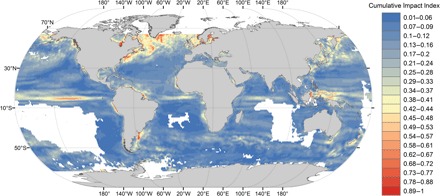
Fig. 1. Global distribution of cumulative environmental impacts.

Index of cumulative impact of equally weighted changes in SST, CHL (a proxy to primary productivity), and ocean currents. Colors represent a dimensionless index of global impact (Cumulative Impact Index) ranging from 0 (no change) to 1 (maximum change), providing a measure of spatial heterogeneity in the magnitude of environmental changes and highlighting those marine areas that have undergone the largest changes in their environmental conditions.
