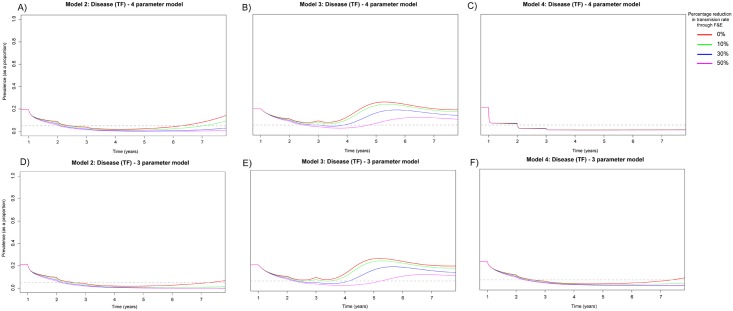
Fig 4. Prevalence of TF in 0–9 year olds when MDA has been applied for 3 annual rounds for 3 years within a community with 20% TF prevalence.
A) Model 2 assuming 20% susceptibility to re-infection in the D and assuming an individual’s infectivity decayed exponentially with each successive infection. B) Model 3 assuming 20% susceptibility to re-infection in the PD and assuming an individual’s infectivity decayed exponentially with each successive infection. C) Model 4 assuming 80% susceptibility to re-infection in the D and assuming an individual’s infectivity decayed exponentially with each successive infection. D) Model 2 assuming 20% susceptibility to re-infection in the D and assuming a linear decline in infectivity with each successive infection. E) Model 3 assuming 20% susceptibility to re-infection in the PD and assuming a linear decline in infectivity with each successive infection. F) Model 4 assuming 80% susceptibility to re-infection in the D and assuming a linear decline in infectivity with each successive infection. For the 4 and 3 parameter versions of Models 2–4 (A–F) we considered variable reductions in the transmission rate β that may be achievable through facial cleanliness and environmental improvements (F&E). We consider instantaneous non-linear declines in β across the 5 year intervention period. We considered maximum reductions in β over the 3 year intervention period to be 0, 10, 30 or 50% from the initial value used.

