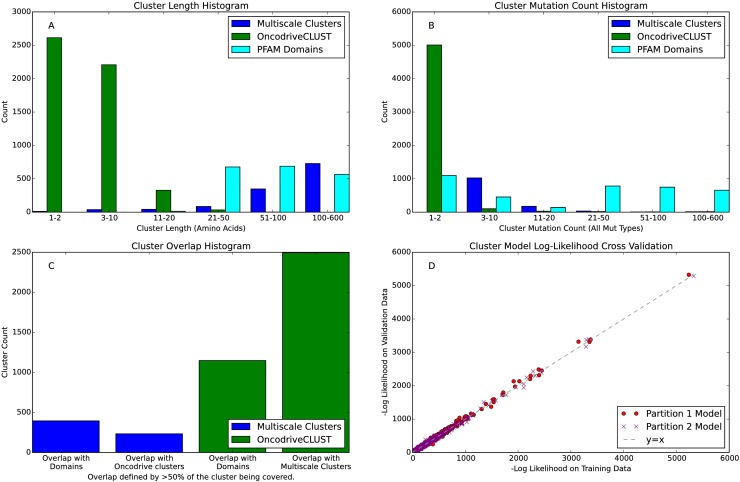
Fig 2. Cluster Statistics Comparing Multiscale Clusters from M2C with the DBSCAN based method OncodriveCLUST and Pfam domains.
A) Cluster length histogram. B) Cluster mutation count histogram using all mutation types. C) Coverage with competing method histogram and Pfam. Cluster X is said to overlap cluster Y if over 50% of cluster X is covered by cluster Y. D) Cross-validation of mixture models: each circle shows the log-likelihood of the mixture model trained from partition 1 to generate the data from partition 2 for a single gene (red circles). The opposite analysis, using partition 2’s mixture model to generate data from partition 1, is also shown (purple x’s).

