Fig. 16.

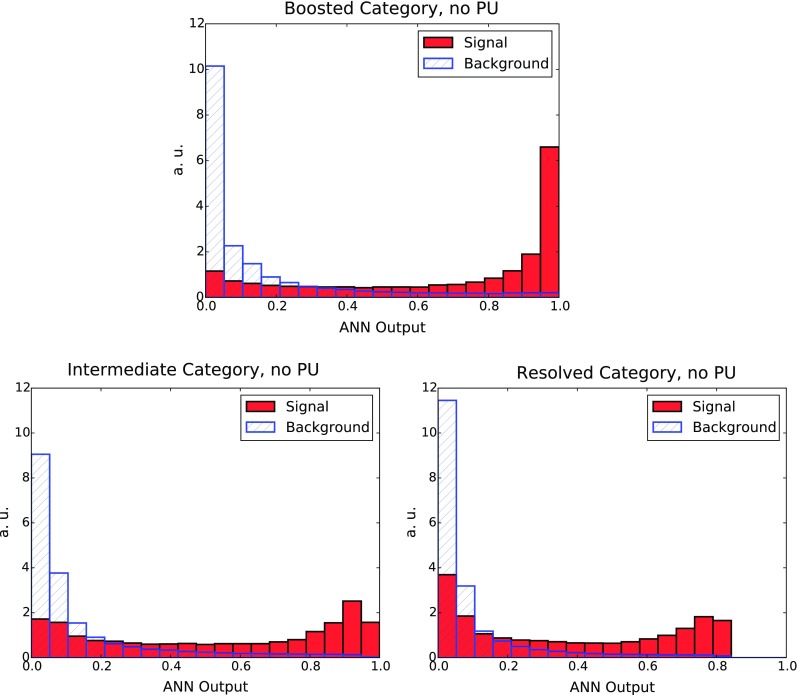
The distributions, at the end of the GA training, for the signal and background MC events in the three categories: boosted (upper plot), intermediate (lower left plot) and resolved (lower right plot), as a function of the ANN output

The distributions, at the end of the GA training, for the signal and background MC events in the three categories: boosted (upper plot), intermediate (lower left plot) and resolved (lower right plot), as a function of the ANN output