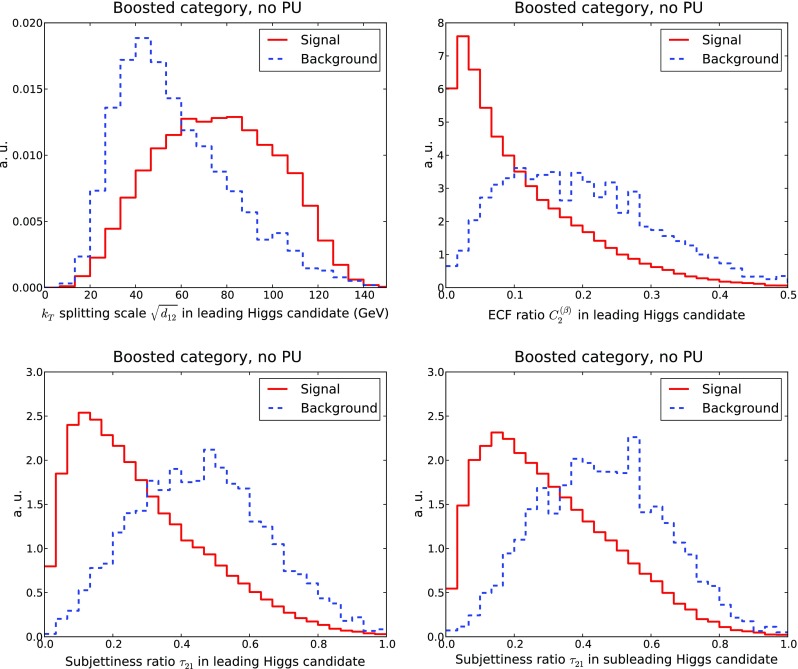
Fig. 8.

Distribution of representative substructure variables in the boosted category at the end of the cut-based analysis, to be used as input to the MVA. From top to bottom and from left to right we show the splitting scale , the energy correlation ratio and the subjettiness ratio for the leading Higgs. In the case of the distributions for the subleading Higgs are also given
