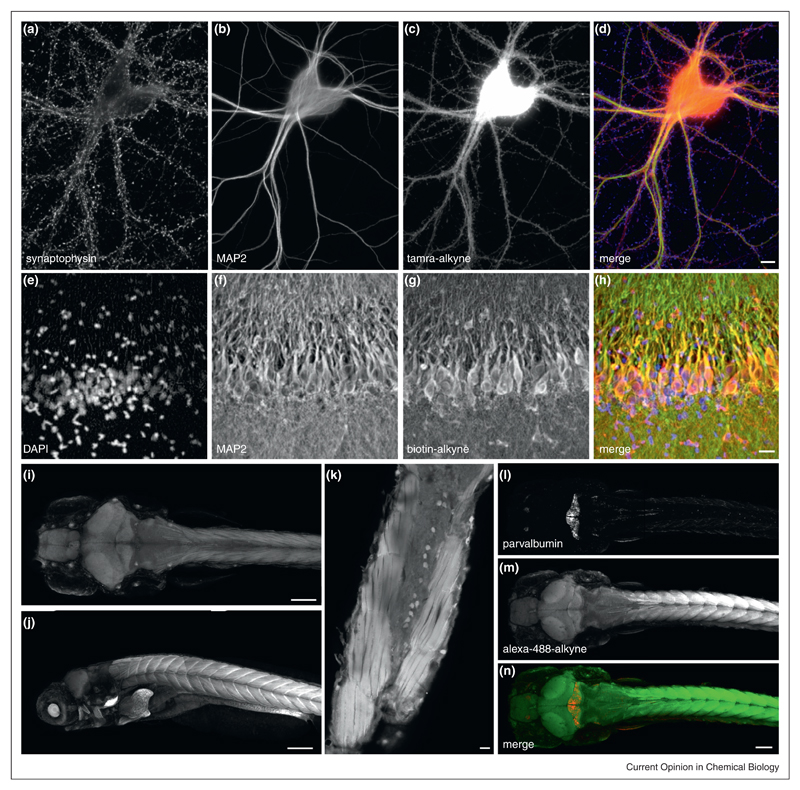
Figure 3.
FUNCAT labeling in dissociated neurons, organotypic hippocampal slices and whole mount zebrafish larvae. (a)–(d) Antibody and FUNCAT labeling of dissociated hippocampal neurons. Scale bar = 10 μm. (e)–(h) Antibody and FUNCAT labeling of organotypic hippocampal slice. FUNCAT labeling was achieved by incubating slice with AHA, ‘clicking’ to biotin alkyne and subsequent immunostaining with mouse anti-biotin primary antibody and Alexa Fluor-594 anti-mouse secondary antibody. Scale bar = 20 μM. (i)–(k) FUNCAT labeling of whole-mount 7-day-old larval zebrafish. (i) dorsal view; (j) lateral view. Scale bar = 150 μm. (k) Dorsal view of cross-section of tail, showing muscles and spinal cord. Scale bar = 20 μm. (l)–(n) Antibody and FUNCAT labeling of whole-mount 7-day-old larval zebrafish. Scale bar = 100 μm.

